


Specifications
AM700 Audio Measurement Set Service Manual
1–37
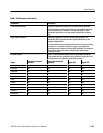
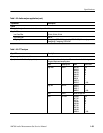
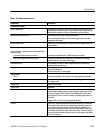
Table 1–24: Audio monitor (cont.)
Capabilities Description
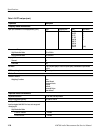
Oscilloscope display
Display Appearance The display is similar to the ones used in the VM700A audio option. Both
channels may be overlaid or put in a ‘split window’ mode. Touch-and-zoom
affects both channels in a window, and graticules track their signals.
Waveform Display Resolution Nominal 400 pixels vertical × 500 pixels horizontal
The reserved pixels for display will shrink during generator control and
programmed text display.
Display Update Rate Minimum of 15 screen updates per second with proper triggering and time
base conditions
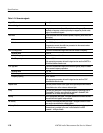
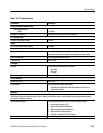
Digitized Record Length
Amount of data in a waveform record obtainable without
missing samples.
Inputs with Sample Rates up to 48 kHz Continuously variable from 32 to 48000 samples per channel
Inputs with Sample Rates Above 48 kHz Continuously variable from 32 samples to 4 milliseconds. All samples
returned must be in the vicinity of the trigger.
Time Base Range Four samples per screen to 48000 samples per screen, continuously
variable with touch-and- zoom
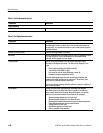
Trigger Sources Channel 1 (A channel)
Channel 2 (B channel)
External (rear-panel TTL input trigger)
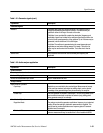
Trigger Modes
Auto New data is displayed in the absence of an edge trigger being detected.
Normal New data is displayed only following detection of a trigger. Trace is erased
if no trigger occurs.
Trigger Slope Rising or Falling edge
Trigger Level Adjustable
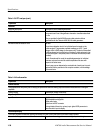
Trigger Position The trigger may be positioned anywhere in the digitized record, with all
samples valid. Pretrigger samples and post-trigger samples must fit within
one record. Trigger position is determined automatically from the views
being displayed. There is no direct control for selecting trigger position in
the record.
Trigger position is at the 0 horizontal graticule marking.
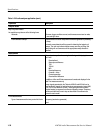
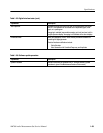
Cursors Cursors can measure time difference and level difference on a waveform.
Cursor position difference for both amplitude and time is displayed in the
cursor readout line above the view. Position difference is obtained by
subtracting the readings obtained from cursor 2 (the dashed cursor) from
the readings obtained from cursor 1 (the solid cursor). The time reading of
the cursor position displayed above the cursor is with respect to the trigger
point in the waveform.