


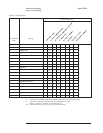

Calibration Error Messages
The dc-offset tables and frequency correction curves produced by the calibration
routine are compared with a set of maximum allowable error curves. The Quick
Confidence self test runs the calibration routine and places error messages in the Test
Log if any measurement exceeds the maximum allowable error. To run the Quick
Confidence self test press the following keys:
[ System Utility ]
[ SELF TEST ]
[ QUICK CONF TEST ]
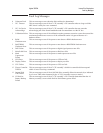
The following lists the possible error messages:
Quick Confidence failure information:
ChannelX0dBfreq
Channel X 20 dB freq
Channel X 40 dB freq
Channel X step attenuator
Channel X –12 dB pad
Channel X +14 dB pad
Quick Confidence FAIL
WhereX=1,2,3,or4andfreq = 100k, 50k, or 25k
Viewing the Calibration Correction Curves
The calibration correction curves can be viewed for any input range or frequency span.
However, there is no frequency correction if the anti-alias filter is bypassed or if the
A-weight filter is on. When there is no frequency correction, the calibration curve is a
flat 0 dB line.
You can save the calibration trace to a data register only when in FFT analysis or
correlation analysis instrument mode. However, these data registers can be displayed
in any instrument mode.
The following key sequence shows how to view the calibration correction curves for
channel 1 and 2 at a 1 Vrms range setting, full span. Other curves can be displayed by
changing the input range and frequency span.
Agilent 35670A Internal Test Descriptions
Calibration Routine Description
10-7