


200 Chapter 5
Language Reference
CALCulate Subsystem
Calculate Peaks of Trace Data
:CALCulate:DATA[n]:PEAKs?
<threshold>,<excursion>[,AMPLitude|FREQuency|TIME]
Returns a list of peaks for the designated trace data n for the currently
selected measurement. The peaks must meet the requirements of the
peak threshold and excursion values.
The command can be used with sub-opcodes (n) for any measurement
results that are trace data. See the table above. Subopcode n=0, raw
trace data cannot be searched for peaks. Both real and complex traces
can be searched, but complex traces are converted to magnitude in
dBm.
Threshold - is the level below which trace data peaks are ignored.
Excursion - To be defined as a peak, the signal must rise above the
threshold by a minimum amplitude change. Excursion is measured
from the lowest point above the threshold (of the rising edge of the
peak), to the highest signal point that begins the falling edge.
Amplitude - lists the peaks in order of descending amplitude, so the
highest peak is listed first. This is the default peak order listing if
the optional parameter is not specified.
Frequency - lists the peaks in order of occurrence, left to right across
the x-axis
Time - lists the peaks in order of occurrence, left to right across the
x-axis
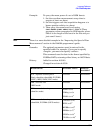
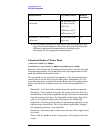
SPECtrum - (frequency domain)
(all modes)
RFENvelope (n=2)
a
for Service mode
IQ (n=3)
a
SPECtrum (n=4)
a
ASPectrum (n=7)
a
yes
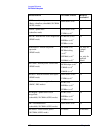
WAVEform - (time domain)
(all modes)
RFENvelope (n=2)
a
IQ (n=8)
a
yes
a. The n number indicates the sub-opcode that corresponds to this
trace. Detailed descriptions of the trace data can be found in the
MEASure subsystem documentation by looking up the
sub-opcode for the appropriate measurement.
Measurement Available Traces Markers
Available?