


252 Agilent N5161A/62A/81A/82A/83A MXG Signal Generators User’s Guide
Real–Time Phase Noise Impairments (Option 432)
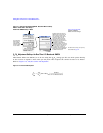
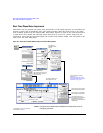
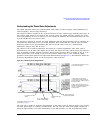
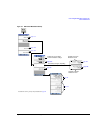
The Agilent MXG Phase Noise Shape and Additive Phase Noise Impairments
Flat mid–frequency offset
(Lmid)
f1
f2
characteristics
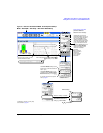
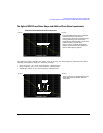
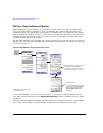
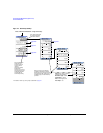
Phase Noise Plots With Phase Noise Impairments
−50 dBc/Hz
−50 dBc/Hz
Flat mid–frequency offset
(Lmid)
characteristics
No additive
phase noise
Resultant phase
noise plot
When turned on, this phase noise is added
to the base phase noise of the signal
generator.
Even though it is only the mid–frequency
characteristics placement that are modified,
these changes affect the entire phase noise
shape. The close in and far out offset
characteristics change by exhibiting
approximately a 20 dBc/Hz slope for each
octave of frequency offset.
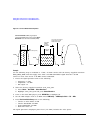
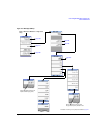
The resultant phase noise plot shown on
the left has the following settings:
• f1 = 100 Hz
• f2 = 1 kHz
• Amplitude (Lmid) = –70 dBc
−20 dBc/Hz
slope
f1
f2
−70 dBc
100 Hz
1 kHz
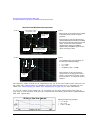
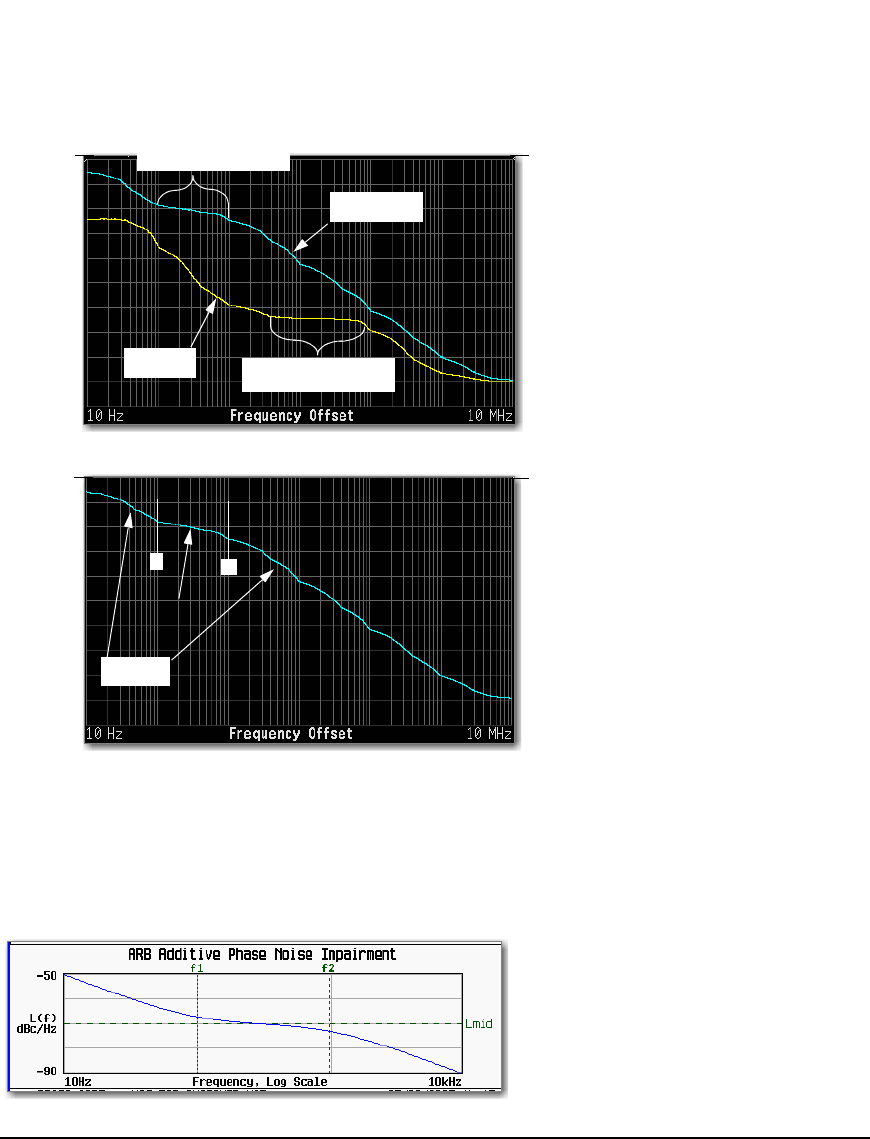
The frequency values entered for the impairments may not be the exact values when viewed on the
RF output. The entered values are guidelines that the signal generator uses to calculate the real
values. See “Understanding the Phase Noise Adjustments” on page 253 for more information.
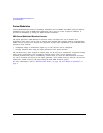
To view the results of the settings (f1, f2, and Lmid), use the front panel graph (below and on
page 250) or view the phase noise plot on a measurement instrument (shown above—Agilent E4440A
PSA with Option 226).
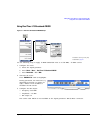
−50 dBc/Hz
−50 dBc/Hz
Signal generator front panel plot:
• f1 = 100 Hz
• f2 = 1 kHz
• Lmid = –70 dBc
Ensure that the f1 value is less than or
equal to f2. If not, f2 changes its value to
match f1. Conversely if f2 is set to a value
that is less than f1, f1 changes its value to
match f2.