


Agilent N5161A/62A/81A/82A/83A MXG Signal Generators User’s Guide 175
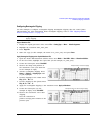
Preliminary Basic Digital Operation (Option 651/652/654)
Preliminary Clipping a Waveform
How Clipping Reduces Peak–to–Average Power
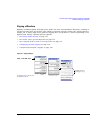
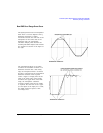
You can reduce peak–to–average power, and consequently spectral regrowth, by clipping the
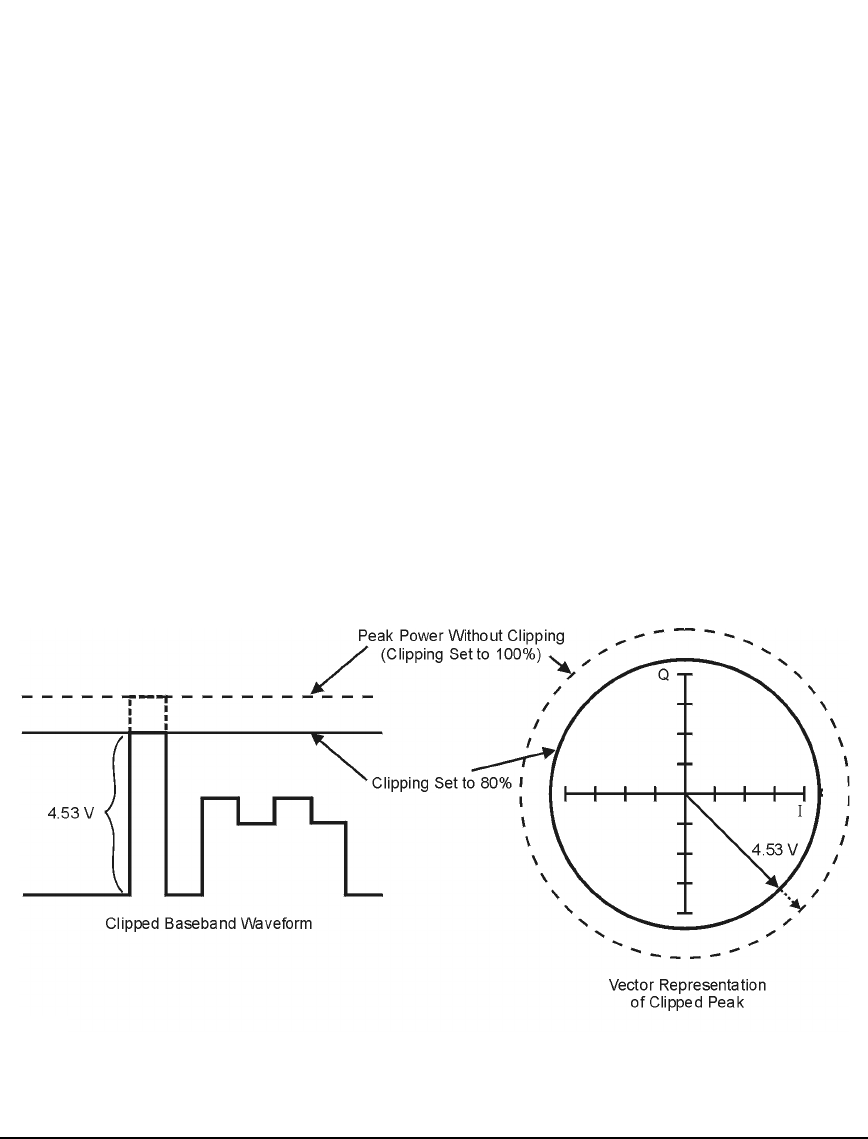
waveform. Clipping limits waveform power peaks by clipping the I and Q data to a selected
percentage of its highest peak. The Signal Generator provides two methods of clipping:
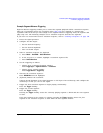
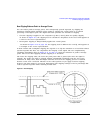
• Circular clipping is applied to the composite I/Q data (I and Q data are equally clipped).
As shown in Figure 8-9, the clipping level is constant for all phases of the vector and appears as
a circle in the vector representation.
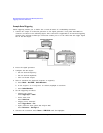
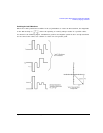
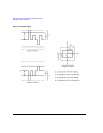
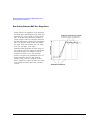
• Rectangular clipping is independently applied the I and Q data.
As shown in Figure 8- 10 on page 176, the clipping level is different for I and Q, and appears as
a rectangle in the vector representation.
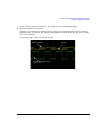
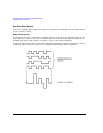
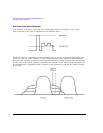
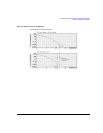
In both circular and rectangular clipping, the objective is to clip the waveform to a level that reduces
spectral regrowth but does not compromise the integrity of the signal. The two complementary
cumulative distribution plots in Figure 8- 11 on page 177 show the reduction in peak–to–average
power that occurs after applying circular clipping to a waveform.
The lower the clipping value, the lower the peak power that is passed (the more the signal is
clipped). The peaks can often be clipped without substantially interfering with the rest of the
waveform. In many cases, data that might otherwise be lost in the clipping process is retained
because of the error correction inherent in the coded systems. If you apply excessive clipping,
however, lost data cannot be recovered. Experiment with clipping settings to find a percentage that
reduces spectral regrowth while retaining needed data.
Figure 8-9 Circular Clipping