


6/08 ST 3000 Release 300 and SFC Model STS103 User’s Manual 163
8.6 Monitoring Local Smart Meter Display
Display description
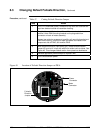
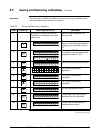
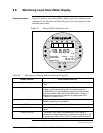
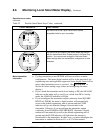
Figure 51 shows a Local Smart Meter display with all its indicators and
segments lit for reference and Table 50 gives a brief description of what
the indications mean.
Figure 51 Display With All Indicators Lit.
%
100
0
18 8
.
8
ANALOG
%
FLOW
In H O
2
K
GPH mmHg
GPM PSI
A
OUTPUT MODE
CHECK STATUS
0
-
UPPER
VALUE
UNITS
LOWER
VALUE
SET
VAR
SEL.
SPAN
ZERO
.
KNOWN VALUE
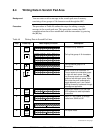
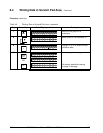
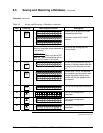
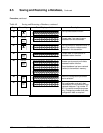
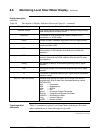
Table 50 Description of Display Indicators Shown in Figure 51
Display Indicator What It Means When Lit
17-Segment Bargraph Gives a gross indication of the transmitter’s PV output from 0 to
100%.
Digital Readout Gives an indication of the transmitter’s PV output in either percent
of span or actual engineering units. The display range is
±19,990,000 and it is automatically ranged to provide the best
precision possible within the limits of the display. A second
decimal place expands the precision of range values within
±19.99 to 1/100th of a unit.
% Digital readout represents output in percent of span. This is the
default engineering units selection.
FLOW Transmitter is configured for Square Root output conformity.
OUTPUT MODE Transmitter is in its output mode and it is not sending a real PV
signal.
CHECK STATUS Transmitter in DE mode is broadcasting a critical status or
transmitter in Analog mode has an output that is less than –2.0%
or greater than 106%. Use the SFC to check transmitter’s status.
Continued on next page