U41117-J-Z125-7-76 301
Global Status History diagrams
7.7.1.3 Time
A pull-down menu with the values 0 - 23 is opened in which you can define the start time
for a display area.
After you have clicked on the required time, the window is closed and the value selected is
taken over.
7.7.1.4 Range
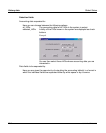
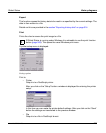
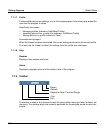
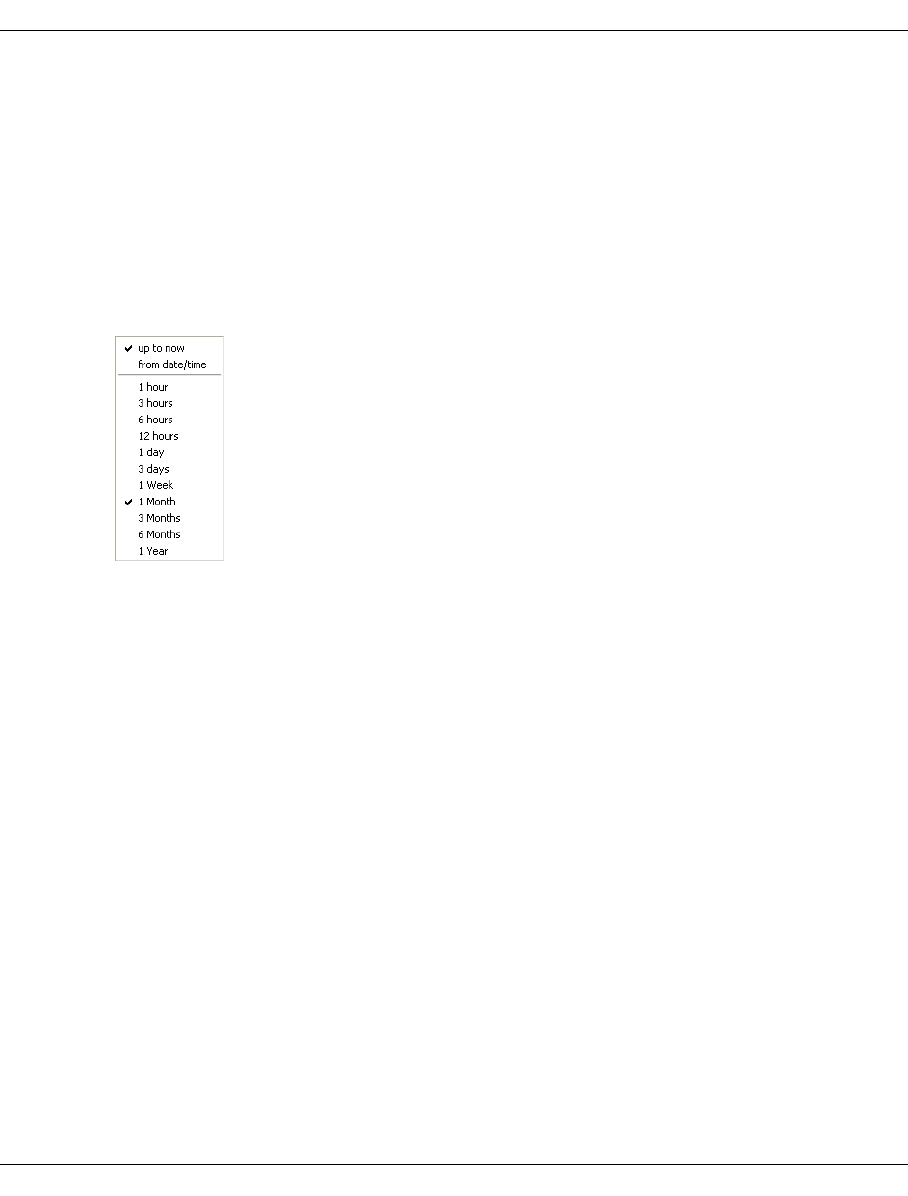
A pull-down menu is opened in which you can define the the display period:
The duration of the display period is defined with the values at the bottom.
The values at the top are used to select whether the display period should start on the date
set and at the time selected (from date/time) or end with the current time (up to now).
After you have clicked on the required field, the window is closed and the value selected is
taken over.
7.7.1.5 Run
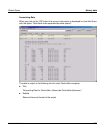
Draw
The statistics are presented again in the window using the data from Date, Time and Range.
Export
A browser is opened which enables you to save the current graphics as a text file.
7.7.1.6 Mode
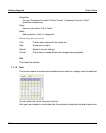
After the diagram has been built up, some diagrams enable you to specify whether the ma-
ximum value (max), the spread (min/max) or the average value (average) should be presen-
ted for each display period. If you select min/max, the maximum and minimum values are
separated by a slash.


