258 U41117-J-Z125-7-76
History data Global Status
7.6.1 General
7.6.1.1 Recording analog operating data
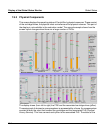
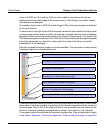
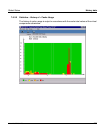
If you move the mouse to a Global Status display and click on the right button, “Show
Statistics” is offered. When you select this function a window opens for presenting the
chronological progress. A description of how to operate this is provided on page 262.
The chronological progress of the following measured data can be displayed:
– data rates of the host interfaces and device controllers for each physical path or globally,
separately for each transfer direction.
– cache statistics
It is possible to create a separate chart for each channel and each device controller. Read
and write operations are both plotted on the same screen.
The various cache occupancy statuses (clean, used, dirty etc.) are displayed in the same
screen for each cache.
It can take some time to build up the diagrams because a large volume of measured data
must be analyzed to present long time periods, e.g. approx. 240 000 samples for one week’s
channel throughput. It is thus possible to abort diagram setup using “Cancel” so as to avoid
quasi-blockages.
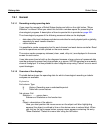
7.6.1.2 Overview of the displays
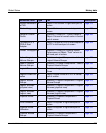
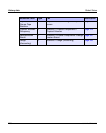
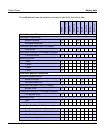
The table below shows the operating data for which chronological recording or tabular
analyses are available.
Explanation
2nd column: Type
H History: Recording over a selecteable period.
T Table with current values.
3rd column: Call
Statistics » .......<menu item>
Submenu of Statistics on the function bar
or
Object: <description of the object>.
Here you must position the mouse cursor on the object until blue highlighting
appears (the object is outlined in blue or the device name is colored blue). When
you click on the right mouse button a popup menu appears containing the entry
“Show Statistics”. Select this menu item using the left button.


