250 U41117-J-Z125-7-76
Display of the Global Status Monitor Global Status
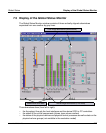
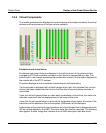
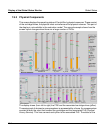
The smaller diagrams on the right indicate the data rates via the ESCON/FICON host
connections (= 390-CH) or FC host connections (=FIBRE-CH) to the virtual drives (top
diagrams) and the data rates via the SCSI or FC controllers to the physical drives (bottom
diagram) for each controller and transfer direction. The ICPs/IDPs are identified by their
names. Long vertical, gray lines indicate the boundaries between the individual ISP areas,
whereas short lines indicate the boundaries between external controllers of a host. If you
rest the mouse pointer on an area, the exact designation will be displayed.
Diagrams relating to host adapter throughput are displayed only for components
actually present. For instance, if CentricStor has no FC host adapter, the top right
diagram will be omitted. There are no device controllers in the evaluation model.
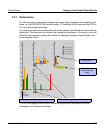
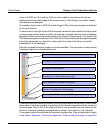
A horizontal line above the bar indicates the maximum value attained since the window was
opened or since the last reset (drag control). The vertical scale of the display (MB/s) is
adapted to the measured data.
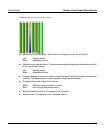
– To reset the drag control for total throughput, click the “Reset” button at the bottom left
of the subwindow.
– The drag controls for the individual host interfaces or drive interfaces are reset using the
buttons displayed under the relevant chart.
– When the mouse pointer hovers above the reset button, an information field appears
telling you the last time it was reset. The system time that is displayed is taken from the
system on which “Global Status” is running. If the drag control has never been reset,
the field displays the time Global Status was started.
i


