


B • Touch Screen Operation
Doc. 065291-01 3/09 217
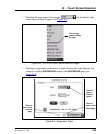
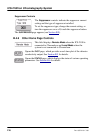
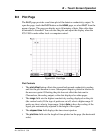
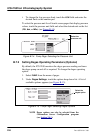
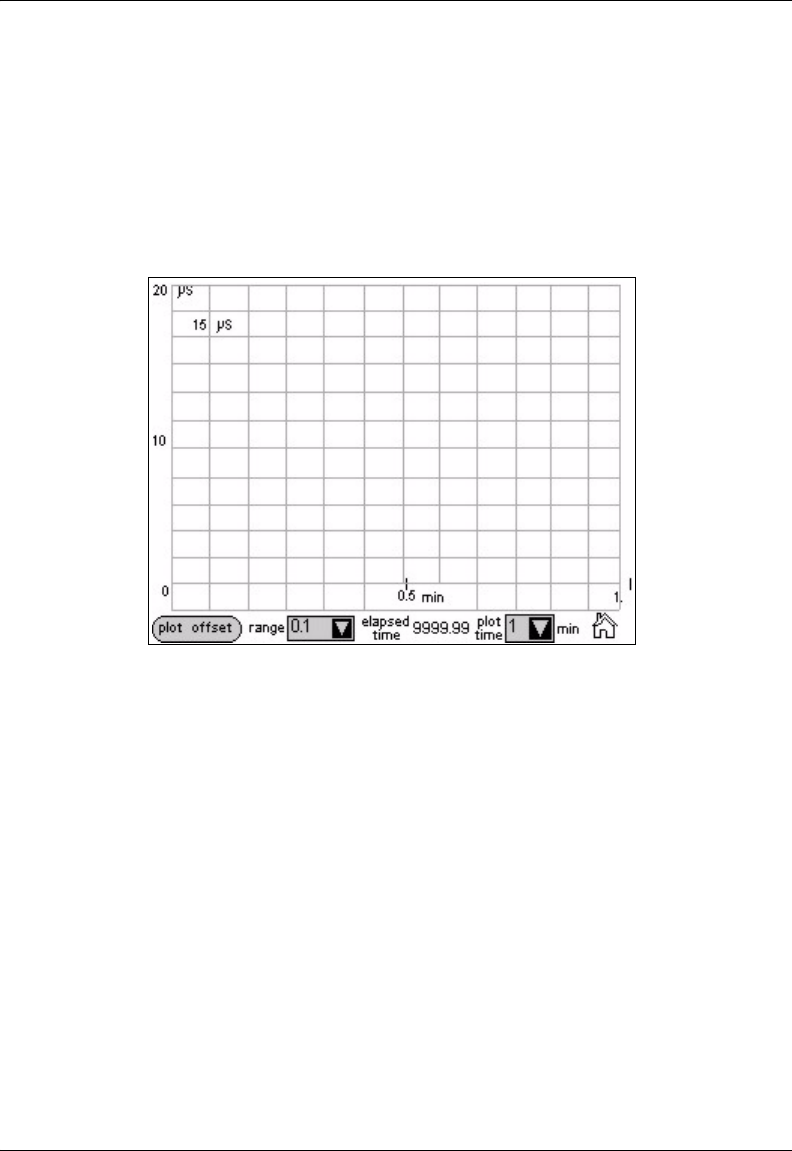
B.5 Plot Page
The PLOT page provides a real-time plot of the detector conductivity output. To
open the page, touch the
PLOT button on the HOME page, or select PLOT from the
menu of pages. The page can display up to 60 minutes of data. Data older than
60 minutes is discarded. You can view the plot and adjust the display when the
ICS-2100 is under either local or computer control.
Plot Controls
• The plot offset button offsets the current background conductivity reading
and sets the plot baseline to zero. Subsequent output is plotted in relation to
the new zero point. Offsetting the plot does not affect the data sent to
Chromeleon, the analog output, or the data displayed on other pages.
• The range field sets the highest conductivity reading displayed on the plot
(the vertical scale). If the tops of peaks are cut off, select a higher range. If
peaks are short, select a lower range. Select
Auto to have the scaling of the
signal plot automatically adjusted to the height of the signal.
• The elapsed time field displays the time since injection.
• The plot time field sets the length of time plotted on the page (the horizontal
scale).
Figure B-8. Plot Page