


© 2003 Shure Incorporated DFR22 Software Guide 83
Parametric Equalizer
Function
Use this processor for precise equalization of room response without unnecessarily affecting neighboring frequen-
cies. Select a parametric equalizer based on the number of frequency bands you need to adjust, and whether or
not you would like to include cut or shelf filters in the processor. You can conserve DSP by selecting the fewest fil-
ters that fit your needs.
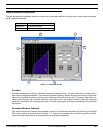
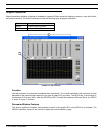
Parameter Window Features
This section explains the features and parameter controls of the parametric equalizer processors using the
PEQ10+CS as the example, as pictured in Figure 7-19 on the previous page. The features of the other parametric
equalizers vary only in the number of bands and the availability of the cut/shelf filters.
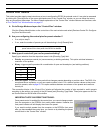
1) Response Graph
This curve is a graphical representation of the combined results of the filter points and handles in the response
plotter.
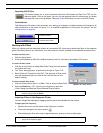
2) Response Plotter
This area of the parameter window is where you place and adjust parametric filters. It graphically displays
peak/notch filters as points and cut/shelf filters as square handles. When you initially open the processor win-
dow, the response plotter contains no filter points and, if applicable, the cut/shelf filters appear in their default
positions. Click on a filter point or handle to view its response curve and adjust settings. Refer to the Working
with Filters section on page 85 for instructions on how to add filter points
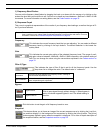
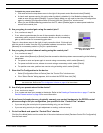
3) Filter Points
Peak/Notch filters appear in the response plotter as filter points with adjustable bandwidth controls on either
side. Click once on a filter point to make it the current selection, then adjust its settings with the mouse, key-
board controls or by using the value boxes.
4) Selected Filter
When a filter is in selection, it appears highlighted in green. Its current curve also appears highlighted in green
along the response graph, relative to zero.
5) Filter Width Handle
Click and drag these handles left and right to narrow or widen the selected filter. The position of these handles
corresponds to the value in the [
WIDTH] control.
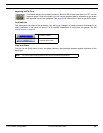
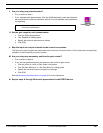
6) Cut/Shelf Filters
The high and low cut/shelf filters appear as square handles. Each handle can be used as either a cut or a shelf
filter, depending on its vertical position in the response plotter. When you first open the parameter window, the
handles operate as high and low shelf filters, with a default setting of 0db at 20kHz and 25Hz, respectively.
They become cut filters when you drag them to the bottom edge of the response plotter.
Note: The number in the block name reflects the maximum number of peak/notch filters available for
that processor.
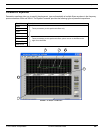
Note: The curve does not reflect the accumulated effect of multiple processor blocks in the signal path.
To view a combined curve, select [View>Combined Response Curve] from the main menu. For
more information, refer to the Combined Response Graph section on page 38.