


© 2003 Shure Incorporated DFR22 Software Guide 67
Digital Feedback Reducer (DFR)
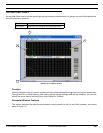
Parameter Window Features
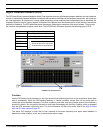
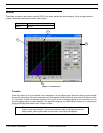
This section explains the features and parameter controls of the digital feedback reducer using the DFR10 as the
example, as pictured above in Figure 7-10. The features of the other DFRs are identical, aside from the number of
notch filters available and stereo functionality.
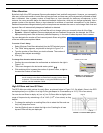
1) Response Graph
This curve is a graphical representation of the combined results of the processor's active notch filters (high-
lighted in yellow).
2) Currently Selected Filter
This line appears in the response graph at the frequency of the currently selected filter, which is indicated
between the two red arrows in the row of feedback filters.
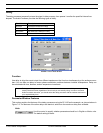
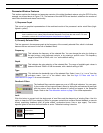
Frequency
This indicates the frequency of the selected filter. You can change the value by clicking on
the spin buttons, using keyboard controls, or by entering a specific value. The frequency
range is from 25Hz to 20kHz, with “
OUT” as the default setting.
Depth
This indicates the gain reduction of the selected filter. The range of available gain values is
between 0db and -18dB in 0.5dB increments, with a default setting of 0dB.
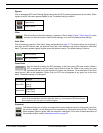
Type
This indicates the bandwidth type of the selected filter. Select “HIGH Q” or “LOW Q” from the
pull-down menu. “
HIGH Q” is the default value. See the High Q Filters and Low Q
Filters section on page 70 for more information.
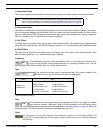
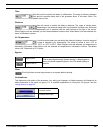
Feedback Filters
The feedback filters controls appear as a row of LED-style indicators. You can spec-
ify the number of fixed versus dynamic filters by sliding the red brackets left and right
with the mouse. Active filters are indicated in yellow and appear in the Response
Graph. Refer to the Filter Allocation section on page 70 for further explanation.
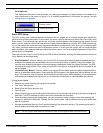
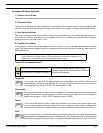
Lock
Click this button to prevent both the deployment of new filters and the deepening of existing filters. Use this
option to keep the DFR from deploying filters for program material that contains desired feedback or sounds
closely resembling feedback (such as guitar effects, synthesized tones, flute or pipe organ). The button
appears lighted in red when the lock feature is active. The default setting is inactive.
Note: The curve does not reflect the accumulated effect of multiple processor blocks in the signal path. To
view a combined curve, select [View>Combined Response Curve] from the main menu. For more
information, refer to the Combined Response Graph section on page 38.
Lock active
Lock inactive