


© 2003 Shure Incorporated DFR22 Software Guide 61
Cut and Shelf Filters
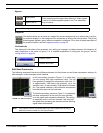
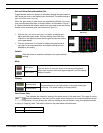
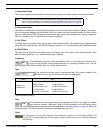
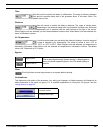
1) Response Graph
This curve is a graphical representation of the combined results of the filter handles in the response plotter.
2) Response Plotter
This area of the parameter window graphically displays the cut and shelf filter handles, which you can manipu-
late by clicking and dragging with the mouse. When you initially open the parameter window, the filter handles
appear in their system default positions at the extreme high and low boundaries of the frequency spectrum.
Click on a handle to view its response curve and adjust settings.
3) Cut Filters
Cut filters appear as handles at the bottom edge of the response plotter, with dashed vertical lines extending
along their center frequencies. Their default frequency setting is “
OUT,” and the default type is 6dB/Butterworth.
4) Shelf Filters
The high and low cut/shelf filters appear along a horizontal axis in the center of the response plotter. Their
default frequency setting is “
OUT,” and the default type is 6dB/oct.
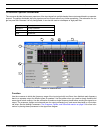
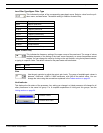
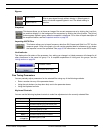
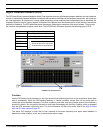
Frequency
This indicates the frequency of the selected filter point. You can change the value by click-
ing on the spin buttons, using keyboard controls, or by entering a specific value. The fre-
quency range is from 25Hz to 20kHz, with “
OUT” as the default setting.
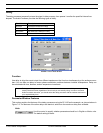
Type
This indicates the slope type for the selected filter. The values available in the
pull-down menu vary for cut and shelf filters, as listed below.
* Indicates default setting
Gain
This indicates the current gain setting of the selected shelf filter. The range of available
gain values is between -18dB and +18dB in 0.5dB increments, with 0dB as the default
value. You can change the value using the conventions explained in the Faders section on page 33. When you
are working with a cut filer this control is disabled and displays the word “CUT.”
Clear
Click this button to return filter settings to their defaults. It opens the “Clear” dialog (Figure 7-20
on page 85), which provides you with the option to clear all filter settings, or to clear only selected
filter settings.
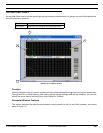
Note: The curve does not reflect the accumulated effect of multiple processor blocks in the signal
path. To view a combined curve, select [View>Combined Response Curve] from the main
menu. For more information, refer to the Combined Response Graph section on page 38.
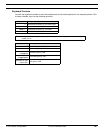
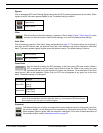
Shelf Cut
6 dB/Octave*
12 dB/Octave
6 dB/oct Butterworth* 18 dB/oct Butterworth
6 dB/oct Bessel 18 dB/oct Bessel
12 dB/oct Butterworth 24 dB/oct Butterworth
12 dB/oct Bessel 24 dB/oct Bessel
12 dB/oct Linkwitz-Riley 24 dB/oct Linkwitz/Riley