


86 Micro Motion
®
Model 1500 Transmitters with the Filling and Dosing Application
Measurement Performance
10.3.2 Additional ProLink II tools for meter verification
In addition to the Pass, Fail, and Abort result provided by the procedure, ProLink II provides the
following additional meter verification tools:
• Test metadata – ProLink II allows you to enter a large amount of metadata about each test so
that past tests can be audited easily. ProLink II will prompt you for this optional data during
the test.
• Visibility of configuration and zero changes – ProLink II has a pair of indicators that show
whether the transmitter’s configuration or zero has changed since the last meter verification
test. The indicators will be green if configuration and zero are the same, and red otherwise.
You can find out more information about changes to configuration and zero by clicking the
button next to each indicator.
• Plotted data points – ProLink II shows the exact stiffness uncertainty on a graph. This allows
you to see not only whether the meter is operating within specification, but also where the
results fall within the specified limits. (The results are shown as two data points: LPO and
RPO. The trending of these two points can help identify if local or uniform changes are
occurring to the flow tubes.)
• Trending – ProLink II has the ability to store a history of meter verification data points. This
history is displayed on the results graph. The rightmost data points are the most recent. This
history lets you see how your meter is trending over time, which can be an important way of
detecting meter problems before they become severe. You can view the graph of past results at
either the beginning or the end of the meter verification procedure. The graph is shown
automatically at the end. Click
View Previous Test Data to view the graph at the beginning.
• Data manipulation – You can manipulate the graphed data in various ways by double-clicking
the graph. When the graph configuration dialog is open, you can also export the graph in a
number of formats (including “to printer”) by clicking
Export.
• Detailed report form – At the end of a meter verification test, ProLink II displays a detailed
report of the test, which includes the same recommendations for pass/caution/abort results
found in Section 10.3.1. You have the options of printing the report or saving it to disk as an
HTML file.
More information about using ProLink II to perform meter verification can be found in the ProLink II
manual (ProLink II Software for Micro Motion Transmitters, P/N 20001909, Rev D or later) and in the
on-line ProLink II help system.
Note: Historical data (e.g., previous test results or whether zero has changed) are stored on the
computer on which ProLink II is installed. If you perform meter verification on the same transmitter
from a different computer, the historical data will not be visible.
10.4 Performing meter validation
To perform meter validation, measure a sample of the process fluid and compare the measurement
with the flowmeter’s reported value.
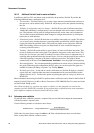
Use the following formula to calculate a meter factor:
Valid values for meter factors range from
0.8 to 1.2. If the calculated meter factor exceeds these
limits, contact Micro Motion customer service.
NewMeterFactor ConfiguredMeterFactor
ExternalStandard
ActualTransmitterMeasurement
-----------------------------------------------------------------------------------
×=