


Appendix B: Automatic Measurements Reference
CSA8000B & TDS8000B User Manual
B-3
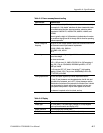
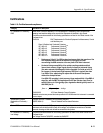
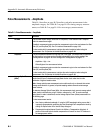
Table B- 1: Pulse Measurements — Amplitude (cont.)
Name Definition
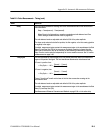
Average Optical Power
(watts)
Where:
H DC Signal Current is the O/E-converter photo detector current in DC amps
H Conversion Gain is the O/ E-converter photo detector gain in amps/watt
Note: Average optical power measurements return valid results only on channels that contain
average power monitors. In general, all optical sampling module channels contain average
power monitors.
To obtai n accurate results, t he O/E converter is calibrated at a fixed number of factory-calibrated
wavelengths to det ermine the conversion gain of the O/E converter at each wavelength.
For best average optical power m easurem ent results:
H Use a factory-calibrated wavelength. If using the USER wavelength setting, ensure that it
is properly compensated by performing the User Wavelength Gain compensation found by
clicking the Optical button in the Vertical Setup dialog box.
H Compensate the optical channel, which corrects for minor DC variances in the average-
power monitor as part of the compensation routine. To access, choose Compensation in
the Utilities menu of the application.
Average Optical Power (watts) =
DC Signal current (DC amps)
Conversion Gain (ampsፒwatts)
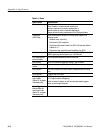
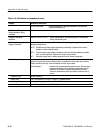
Cycle Mean The arithmetic mean of t he waveform over the first cycle of the measurement region. The
waveform cycle is determi ned at the crossings of the mi d-reference level. See Measurement
Reference Param eters and Methods on page B--56. Also see Reference Levels Method on
page 3--79.
The mid-reference level is adjustable and defaults to 50% of the pulse amplitude.
If enabled, measurement gates constrain the measurement region to the area between the Start
Gate (G1) and Stop Gate (G2). See To Localize a Measurement on page 3--83.
For best results with this measurement, optimize the vertical resolution before taking this
measurement. See To Optimize the Vertical Resolution on page B--69.
Cycle RMS The root-mean-square amplit ude of the waveform within the first period of the measurement
region.
If enabled, measurement gates constrain the measurement region to the area between the Start
Gate (G1) and Stop Gate (G2).
For best results with this measurement, optimize the vertical resolution before taking this
measurement. See To Optimize the Vertical Resolution on page B--69.