


Using Masks, Histograms, and Waveform Databases
3-160
CSA8000B & TDS8000B User Manual
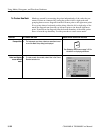
H If all four databases are assigned and you attempt to implicitly assign a
waveform source to a database (for example, by right clicking a waveform
icon in the Waveform bar and selecting color grading), the instrument will
display a notice that no databases are available.
NOTE. The above exclusion does not mean that a waveform database cannot be
used by multiple systems or features. For example, you can use the same
database as the source for a histogram, an automatic measurement, and a mask
test.
Interpolation or vector displays. Waveform database accumulation is always a dot
mode accumulation; therefore, no interpolation or vectoring is performed.
The key points that follow describe operating considerations for setting up a
waveform database.
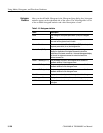
Dimensions. Waveform database dimensions match those of the database source
and are described as follows:
H Horizontal (columns): Always 500 columns, which is the maximum
horizontal graticule view size. Columns are in horizontal units that match the
horizontal units of the source.
H Vertical (rows): Always 402 rows, which is the maximum vertical graticule
size plus one row each for overrange (OR) and underrange (UR). Rows are
in vertical units that match the vertical units of the source.
H Count (weights or density): up to 32 bits.
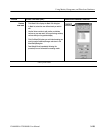
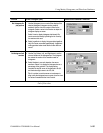
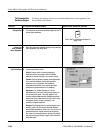
Display. When you assign a waveform database to a waveform source (using the
Waveform Database Setup dialog box) you must explicitly turn on the waveform
database display if you wish to see it on screen; otherwise, the waveform source
displays using the default (vector) display. The waveform database still
accumulates in the backgr ound and can be turned on later without clearing the
database.
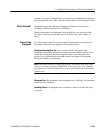
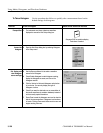
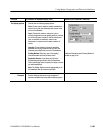
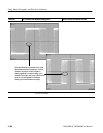
Display Options. The Color, Intensity, and Invert controls determine whether the
instrument displays its databases graded by color or intensity.
H Color: Different colors are used to indicate data-accumulation density.
H Intensity: Dif ferent shades of one color are used to indicate density.·
H Invert: When Invert is selected, colors and intensities that are indicating
high data-accumulation counts toggle to indicate low counts. Inverting the
colors or intensities can sometimes make the data that occurs least in the
waveform database easier to see.
Keys to Using