


Using Masks, Histograms, and Waveform Databases
3-158
CSA8000B & TDS8000B User Manual
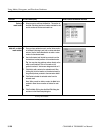
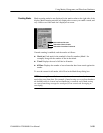
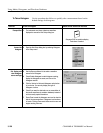
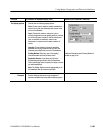
After you check Enable Histogram in the Histogram S etup dialog box, histogram
statistics appear on the right-hand side of the screen. The following table is a list
of the available histogram statistics and a brief description of each.
Table 3- 10: Histogram statistics
Name Description
Mean The average of all acqui red point s wi thin (or on) the histogram
box.
Median Half of al l acquired points within (or on) the histogram box are less
than and half are greater than this value.
Standard D eviation The standard deviation (Root Mean Square (RMS) deviation) of all
acquired points within (or on) the histogram box.
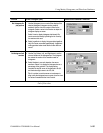
Peak-to-Peak (Pk-Pk) The peak-to-peak value of the histogram. Vertical histograms
display t he amplitude of the highest nonzero bin minus the
amplitude of the lowest nonzero bin. Horizontal histograms display
the time of the rightmost nonzero bin minus the time of the
leftmost nonzero bi n.
Meanᐔ1 StdDev(ᐔ1σ) The percentage of points in the histogram whic h are within 1
standard deviation of the histogram mean.
Meanᐔ2 StdDev(ᐔ2σ) The percentage of points in the histogram whic h are within 2
standard deviations of the histogram mean.
Meanᐔ3 StdDev(ᐔ3σ) The percentage of points in the histogram whic h are within 3
standard deviations of the histogram mean.
Peak Hits Displays the number of points in the largest bin of the histogram.
# of Histogram Hits Displays the number of hits within or on the histogram box.
# of Wavef orms Displays the number of waveforms that have contributed to the
histogram.
Histogram
Statistics