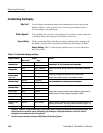
Measuring Waveforms
3-74
CSA8000B & TDS8000B User Manual
Taking Automatic Measurements
This powerful and flexible tool provides automatic extraction of various
parameters from the waveforms that this instrument acquires. Automated
measurements quickly give you immediate, continuously updating, measurement
results for a rich selection of waveform parameters, such as risetime or extinction
ratio. You also can display statistics on how the measurement results vary as they
continuously update. See What’s Excluded on page 3--76 for information on the
??? indicator when measuring waveform parameters.
You get to choose:
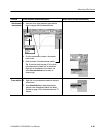
H Most automatic measurements require both a source selection and a
measurement selection. To quickly select a measurement, use the measure-
ment toolbar to first set the waveform type, Pulse, RZ, or NRZ, and then
select a category, Amplitude, Timing, or Area, in the pulldown lists of the
toolbar. Next, click the icon of the measurement that you want to use to
measure the selected waveform (or drag the icon to any waveform, selected
or not, on screen to measure that waveform). The results appear in the
measurements readout at the right of the screen. See the procedure that starts
on page 3--80.
H Select from the extensive range of parameters this instrument can measure;
for a list, see Appendix B: Automatic Measurements Supported. This section
of the manual defines the supported measurements (selections) for each
category.
H Feed the entire waveform to a measurement or limit the measurement to a
segment of the waveform. By default, the instrument takes each automatic
measurement over the entire waveform record, but you can use measurement
gates to localize each measurement to the section of a waveform (see To
Localize a Measurement on page 3--83).
H Select from these measurement sources: channel, reference, and math
waveforms, and waveform databases 1 through 4.
This instrument implements a robust automatic measurement system. Some of
the features adding value to this system follow.
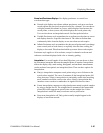
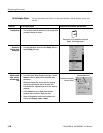
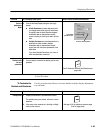
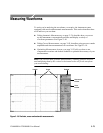
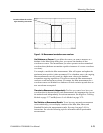
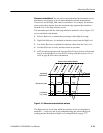
Annotate Waveforms On Screen. You can turn on annotations that mark character-
ization levels that each measurement uses to compute results. See Figure 3--19.
Why Use?
What’s Measured?
What’s Special?


