


CSA7000 Series, TDS7000 Series, & TDS6000 Series Instruments User Manual
B-1
Appendix B: Automatic Measurements Supported
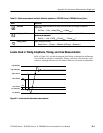
This appendix provides a list of all supported measurements and their defini-
tions. An illustration showing the levels used to take measurements is also
included.
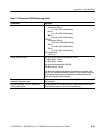
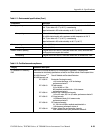
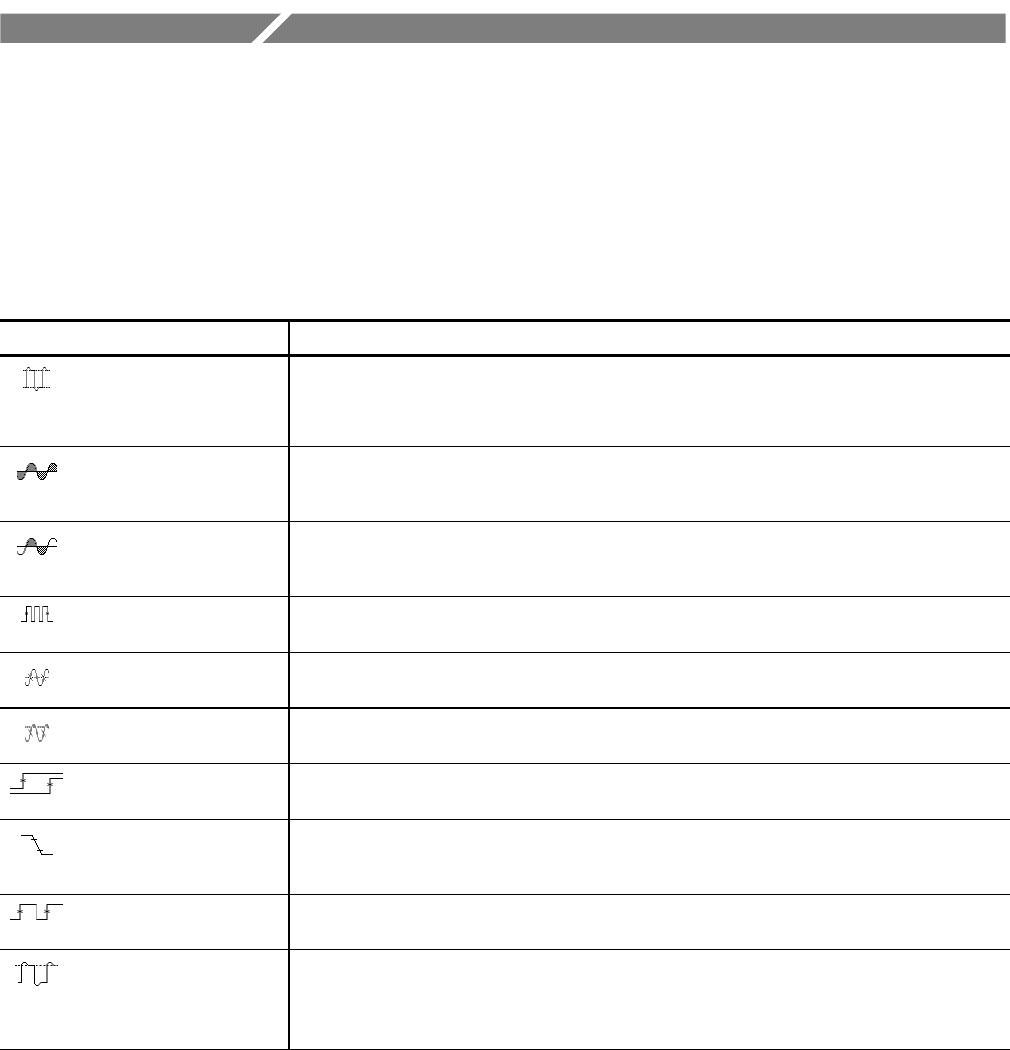
Table B- 1: Supported measurements and their definition
Name Definition
Amplitude Voltage measurement. The high value less the low value measured over the entire waveform or
gated region.
gated region.
Amplitude = High--Low
Area Area measurement (Voltage over time measurement). The area over the entire waveform or
gated region in volt-seconds. Area measured above ground is positive; area below ground is
negative.
Cycle Area Voltage over time measurement. The area over the first cycle in the waveform, or the first cycle
in the gated region, in volt-seconds. Area measured above ground is positive; area below
ground is negative.
Burst Width Timing measurement. The duration of a burst. Measured over the entire waveform or gated
region.
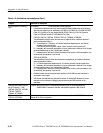
Cycle Mean Voltage measurement. The arithmetic mean over the first cycle in the waveform or the first cycle
in the gated region.
Cycle RMS Voltage measurement. The true Root Mean Square voltage over the first cycle in the waveform
or the first cycle in the gated region.
Delay Timing measurement. The time between the MidRef crossings of two different traces or the
gated region of the traces.
Fall Time Timing measurement. Time taken for the falling edge of the first pulse in the waveform or gated
region to fall from a Hi gh Ref value (default = 90%) to a Low Ref value (default =10%) of its
final value.
Frequency Timing measurement for the first cycle in the waveform or gated region. The reciprocal of the
period. Measured in Hertz (Hz) where 1 Hz = 1 cycle per second.
High The value used as 100% whenever High Ref, Mid Ref, and Low Ref values are needed (as in fall
time and rise time measurements). Calculated using either the min/max or the h istogram method.
The min/max method uses the maximum value found. The histogram method uses the most
common value found above the mid point. Measured over the entire w aveform or gated region.