


Creating and Using Math Waveforms
CSA7000 Series, TDS7000 Series, & TDS6000 Series Instruments User Manual
3- 229
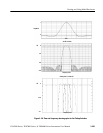
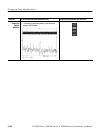
Another way to observe aliasing, if you have a variable frequency signal source,
is to adjust the frequency slowly while watching the spectral display. If some of
the harmonics are aliased, you will see the harmonics decreasing in frequency
when they should be increasing or vice versa. Using averaging in either the time
or frequency domain will make these frequency shifts more sluggish.
To Take Cursor Measurements of a Spectral Math Waveform. Once you have
displayed a spectral math waveform, use cursors to measure its frequency
amplitude or phase angle. See Taking Cursor Measurements on page 3--160.
To Take Automated Measurements of a Spectral Math Waveform. You can use
automated measurements to measure spectral math waveforms. Use the
procedure To Take Automated Measurements on page 3--153.
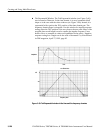
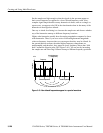
Swept Sine Wave Analysis. Many applications of the spectral analyzer require
swept sine wave input. The following equation determines what the maximum
sweep speed of the sine wave generator should be for a given span and resolution
bandwidth.
T =
(
freq span * K
)
RBW
2
T = minimum time to sweep the sine over the requested span
freq span = frequency span of interest
RBW = resolution bandwidth
K = 2 dB B W in bins for the window function in use as shown in Table 3--13 on
page 3--216. K = 2 for a Gaussian window.