


Creating and Using Math Waveforms
CSA7000 Series, TDS7000 Series, & TDS6000 Series Instruments User Manual
3- 207
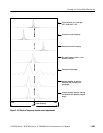
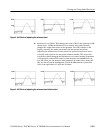
Using the Frequency Domain controls. The gated region of the source waveform is
transformed by the spectral analyzer to a spectral waveform. This may be a phase
or magnitude waveform. The horizontal units are always Hz. The vertical units
depend on whether phase or magnitude is selected. The frequency domain
controls for the spectral waveform are span, center, and resolution bandwidth.
The spectrum normally appears on the display fit to a screen width of 10 divi-
sions.
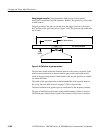
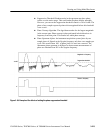
H Span. The span is the stop frequency at the end of the spectral waveform
minus the start frequency at the beginning of the waveform. The span control
maximum value is equal to the current sample rate divided by two. There-
fore, if you are unable to increase the span to the desired value and if you
want to keep the same source waveform duration, go to the timebase controls
and increase the sample rate using the resolution control. Or, if you want to
also decrease the source waveform duration, adjust the sample rate control. If
you decrease the sample rate, the span setting may decrease, if necessary, to
keep the span less than the sample rate divided by two.
H Center. This is the frequency at the center of the spectral waveform. Center is
equal to the start frequency plus one half of the span. The adjustment range
depends on the sample rate and the current span setting. Remember that the
span must always be in the interval of zero to one half of the sample rate.
Where one end of the span goes to DC or Nyquist, depending on which
direction the center frequency is adjusted, the span decreases to allow the
center frequency to go further in the direction it is being adjusted. If you are
unable to increase the center to the desired value then increase the sample
rate using either the sample rate or resolution controls. You may also change
sample rate by using the HORIZONTAL SCALE knob on the instrument
front panel.
H Resolution Bandwidth, RBW. This is the 3 dB down bandwidth of the
spectral analyzer frequency response to a sine wave input. The resolution
bandwidth is affected by two parameters.
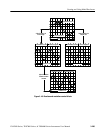
H Different window functions produce different filter response shapes in
the spectrum and result in different resolution bandwidths.