


Creating and Using Math Waveforms
3- 212
CSA7000 Series, TDS7000 Series, & TDS6000 Series Instruments User Manual
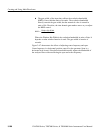
H Real and Imaginary Magnitudes. You may set the spectral analyzer to display
the linear magnitude of the real data or the imaginary data in the spectrum.
This is useful if you process the spectrum off line and transform it back into
a time domain trace. You could save the real and the imaginary spectrum into
a reference memory. You can export the waveforms directly into Mathcad,
Matlab, and Excel documents and update in real time.
To turn on a real or imaginary spectrum, touch the Math button, the
Define/Edit Expression Editor button, and then select the Freq tab. Touch
either the Real or the Imag menu items to enter an expression. Then touch
the Ch tab and one of the channel buttons. Touch apply.
Using the Phase Controls. You can set the vertical units to degrees, radians, or
seconds of group delay. You select these choices by touching the Math button,
the Spectral Analysis Setup button, and then selecting the Phase tab. Select the
desired scale type from Degrees, Radians, or Group Delay.
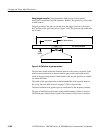
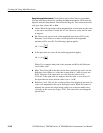
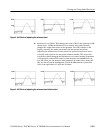
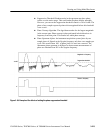
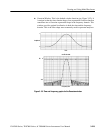
H Phase Reference Position. Phase is a relative measurement that must have a
time domain reference point. The phase value is specified with respect to this
phase reference position.
For the spectral analyzer, the phase reference position is the 50% position of
the gate, that is, the middle of the gate interval of the data that is input to the
spectral analyzer. This is true for all window functions except for the Tek
Exponential window. This window has the reference point at the 20%
position of the gate.
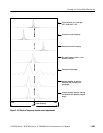
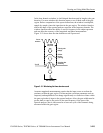
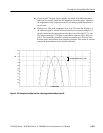
H Phase Unwrap. The spectral analyzer produces phase values from --π to
π radians or --180 to 180 degrees. However, when you perform impulse
response testing and the phase is continuous, then phase values outside these
ranges may occur. The spectral analyzer then wraps the data with disconti-
nuities in the display from +180 to --180 degrees. Phase unwrap will display
the correct result by unwrapping the phase.
Phase unwrap is only valid when the phase spectrum is a continuous
function of frequency. Therefore, do not use it when analyzing the harmonic
content of the typical repetitive signal.