


Data Input/Output
3- 272
CSA7000 Series, TDS7000 Series, & TDS6000 Series Instruments User Manual
Overview Control elements and resourcesTo use exported waveforms (Cont.)
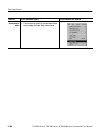
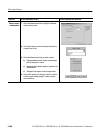
Begin your
chart
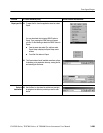
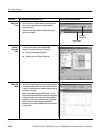
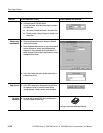
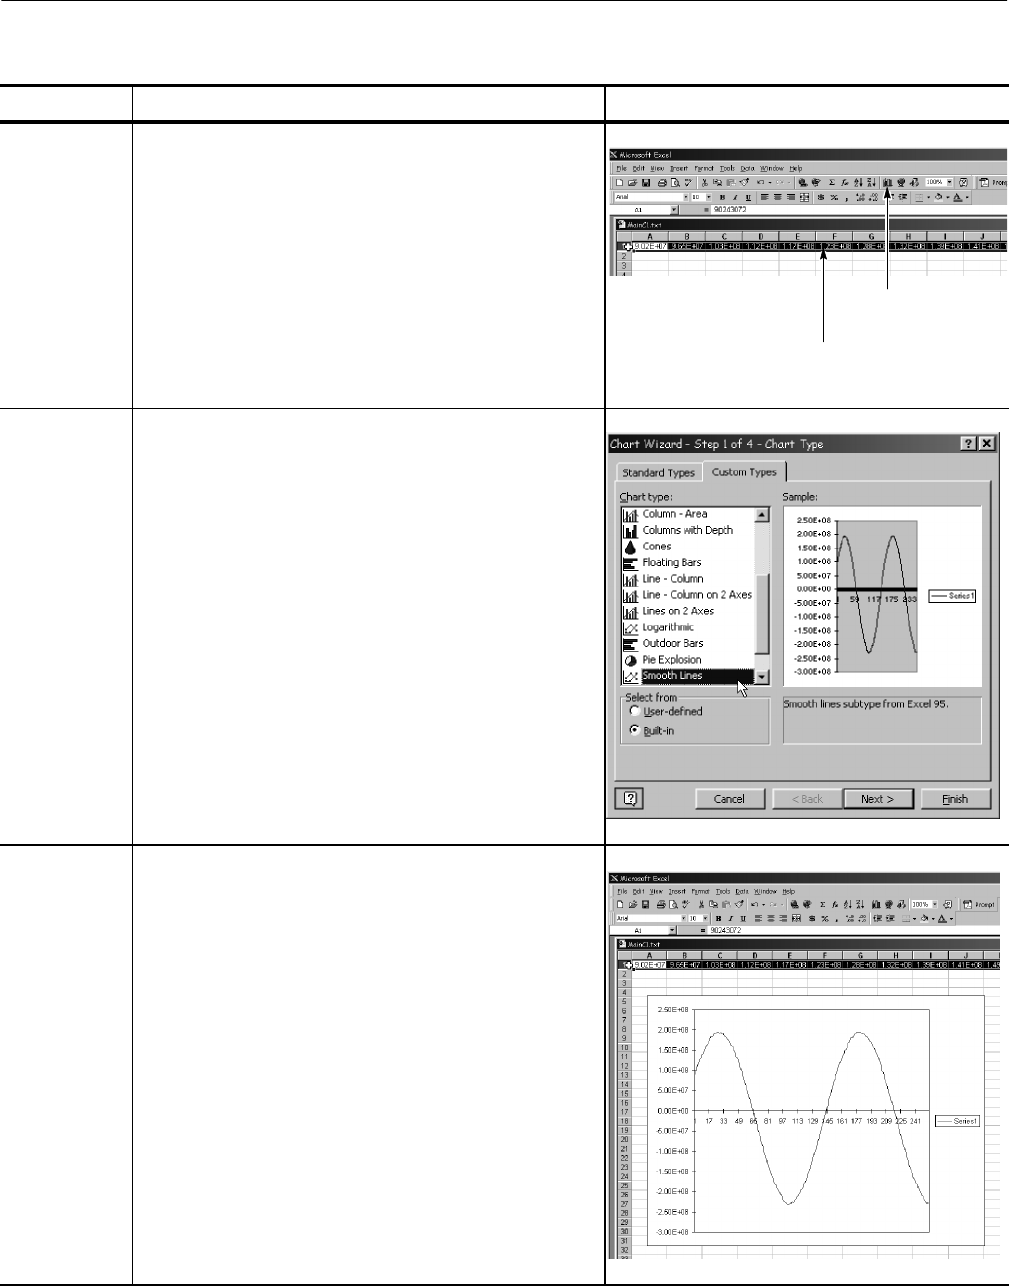
5. Clic k on t he row or column number to select the enti re
row or column containing your imported waveform
values (see right).
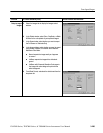
6. Select the Chart button from the toolbar (see right) or
from the Insert menu.
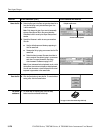
Access the
Chart Wizard
Select the entire
row or column
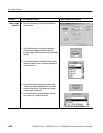
Specify a
line-graph
chart
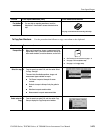
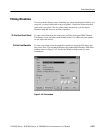
7. From the Chart Wizard, make sure Built In is
selected. Then select either of the following:
H Lines in the Standards Types tab
H Smooth lines in the Custom Types tab
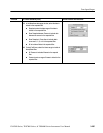
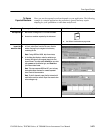
Finish the
chart
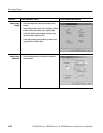
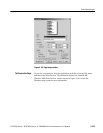
8. Clic k Next to step through the next two steps accepting
the defaults setting at each step. Click the Finish button
in step 4. You should have a waveform display similar to
that shown at the right.
Note. This procedure assumes MS Excel 97. You can
likely specify titles, customize the treatment and labeling
of the x and y axes, and so forth in y our data-analysis
application—either as you create the chart or afterward.
Use the help for your data-analysis application to
determine if it has these capabilities and for instructions
in using them.