


Chapter 4 129
Making Measurements
Making the Adjacent Channel Power (ACP) Measurement
Bar Graph (Total Pwr Ref) - A histogram of powers referenced
to the total power
Bar Graph (PSD Ref) - A histogram of powers referenced to the
mean power spectral density of the carrier in dBm/Hz
•
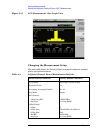
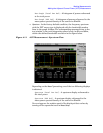
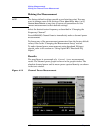
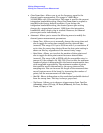
Spectrum - In the factory default condition, the frequency spectrum
with the FFT sweep type is displayed with the bandwidth marker
lines in the graph window. The corresponding measured data in the
text window is the total integration power levels, in dBc and dBm,
within the defined bandwidth as shown in the figure below.
Figure 4-11 ACP Measurement - Spectrum View
Depending on the
Meas Type setting, one of the two following displays
is obtained:
Spectrum (Total Pwr Ref) - A spectrum display referenced to
the total power
Spectrum (PSD Ref) - A spectrum display referenced to the
mean power spectral density of the carrier in dBm/Hz
You can improve the update speed of the displayed data values by
turning off the spectrum trace in
Meas Setup.