


128 Chapter 4
Making Measurements
Making the Adjacent Channel Power (ACP) Measurement
Res BW - This key is always grayed out. However, it allows you
to see the resolution bandwidth that is derived from the
combination of sweep time, data points, and FFT segments.
Num FFT Seg - The automatic mode selects the optimum
number of FFT segments to measure the offset, while making
the fastest possible measurement.
Relative Atten - Allows you to set a relative amount of
attenuation for the measurements made at your offsets. The
amount of attenuation is always specified relative to the
attenuation that is required to measure the carrier channel.
Since the offset channel power is lower than the carrier
channel power, less attenuation is required to measure the
offset channel and you get wider dynamic range for the
measurement.
•
Meas Type - Allows you to access the menu to select one of the
measurement reference types.
—
Total Pwr Ref - Select this to set the total carrier power to the
measurement reference level and the measured data is shown in
dBc and dBm.
—
PSD Ref - Select this to set the mean power spectral density of the
carrier to the measurement reference level and the measured
data is shown in dB and dBm/Hz.
•
Fast ACP - Allows you to increase the speed of the measurement. A
time domain computation method is used rather than an FFT
transformation. When this faster measurement method is selected,
repeatability is slightly reduced.
•
Spectrum Trace - Turns off the spectrum trace data calculations. This
is only applicable when using the Spectrum View. It speeds up the
display of the other measured data values by not calculating the
spectrum trace.
•
Limit Test - Turns off the limit test function.
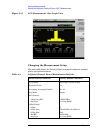
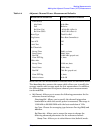
Changing the View
The View/Trace key accesses the menu to select either Bar Graph or
Spectrum for the measurement result, depending on the Sweep Type
setting.
•
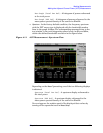
Bar Graph - In the factory default condition 5 of the total integration
power levels, centered at the carrier frequency and
±750.0 kHz and
±1.98 MHz offset frequencies, are shown in the figure for the
“Results” section. The corresponding measured data is shown in the
text window. Depending on the
Meas Type selection, one of the two
following displays is obtained: