


Chapter 4 103
Making Measurements
Making the Spectrum (Frequency Domain) Measurement
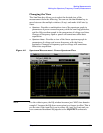
Changing the View
The View/Trace key allows you to select the desired view of the
measurement from the following. You can use the
Next Window key to
move between the multiple windows (if any) and make it full size by
Zoom.
•
Spectrum - Provides a combination view of the spectrum graph in
parameters of power versus frequency with the semi-log graticules,
and the I/Q waveform graph in the parameters of voltage and time.
Changes to frequency span or power will sometimes affect data
acquisition.
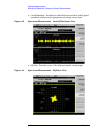
•
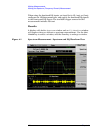
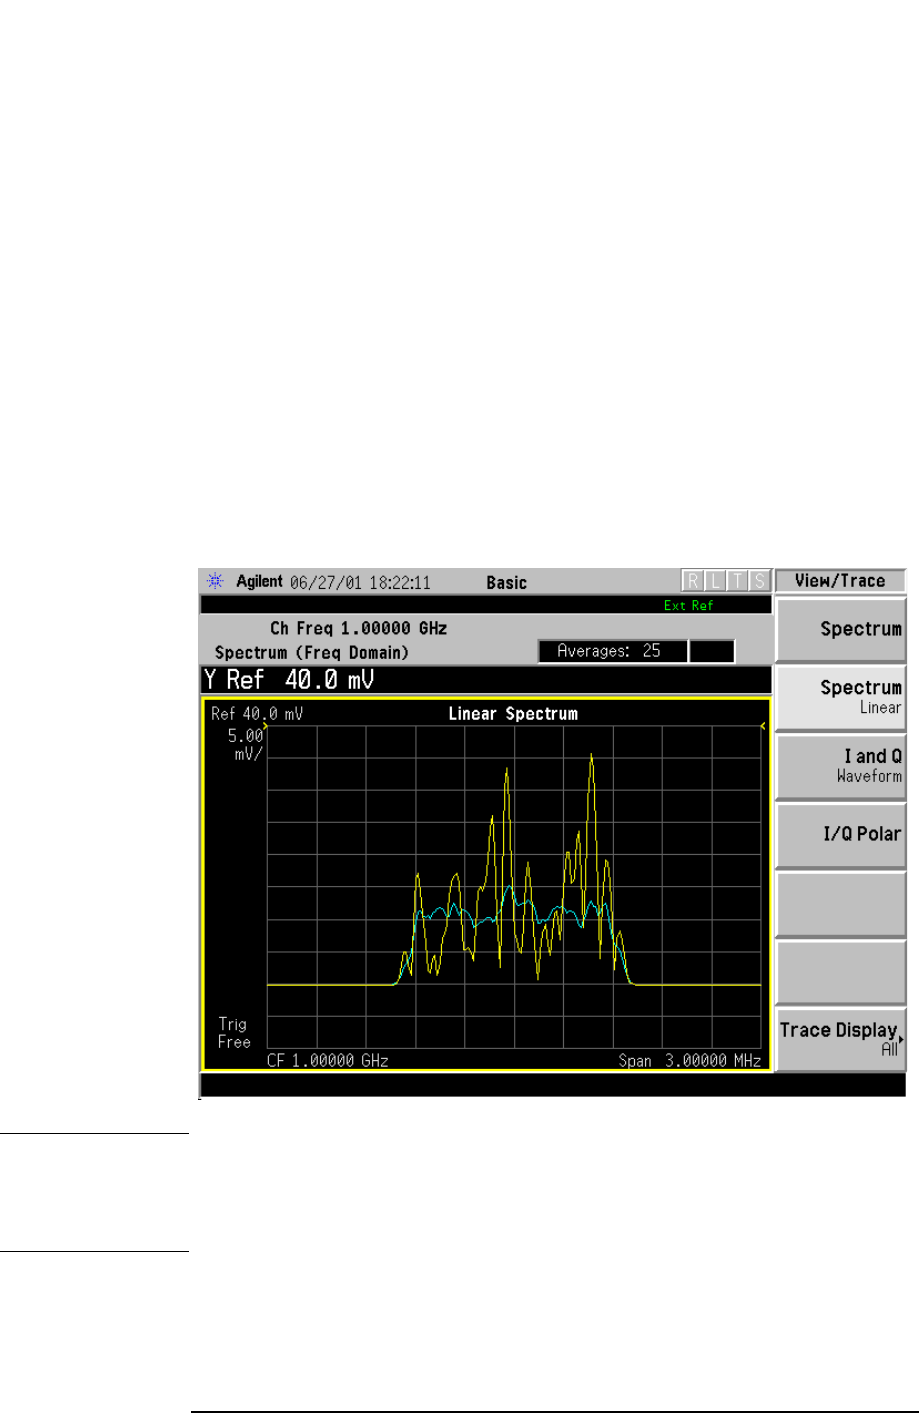
Spectrum Linear - Provides a view of the linear spectrum graph in
parameters of voltage and versus frequency with the linear
graticules. Changes to frequency span or voltage will sometimes
affect data acquisition.
Figure 4-2 Spectrum Measurement - Linear Spectrum View
NOTE For the widest spans, the I/Q window becomes just “ADC time domain
samples”, because the I/Q down-conversion is no longer in effect. This is
not the case if the
Input Port is set to either I/Q, I only, or Q only and you
have connected baseband I/Q signals to the I/Q INPUT connectors.