


82 Chapter 2
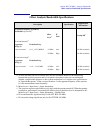
Option B25 (25 MHz) - Analysis Bandwidth
Other Analysis Bandwidth Specifications
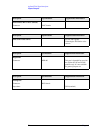
Description Specifications Supplemental Information
SFDR (Spurious-Free Dynamic Range)
Test conditions
a
a. Signal level is –6 dB relative to dBfs where: FS = –10 dBm at mixer, IF Gain = 0..
Signal Frequency within ±12 MHz of center –75 dBc
Signal Frequency anywhere within analysis BW –70 dBc (nominal)
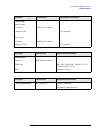
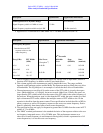
Description Specifications Supplemental Information
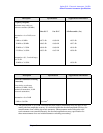
IF Frequency Response
a
a. The IF frequency response includes effects due to RF circuits such as input filters, that are a
function of RF frequency, in addition to the IF pass-band effects.
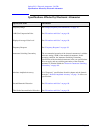
Demodulation and FFT
response relative to the
center frequency
95
th
Percentile
Freq (GHz)
FFT Width
b
(MHz)
b. This column applies to the instantaneous analysis bandwidth in use. The range available
depends on the hardware options and the Mode. The Spectrum analyzer Mode does not allow
all bandwidths. The I/Q Analyzer is an example of a mode that does allow all bandwidths.
Max Error
c
(Exceptions
d
)
c. The maximum error at an offset (f) from the center of the FFT width is given by the expres-
sion
± [Midwidth Error + (f ×Slope)], but never exceeds ±Max Error. Usually, the span is no
larger than the FFT width in which case the center of the FFT width is the center frequency of
the analyzer. When the analyzer span is wider than the FFT width, the span is made up of mul-
tiple concatenated FFT results, and thus has multiple centers of FFT widths so the f in the
equation is the offset from the nearest center. These specifications include the effect of RF fre-
quency response as well as IF frequency response at the worst case center frequency. Perfor-
mance is nominally three times better at most center frequencies.
d. The specification does not apply for frequencies greater than 3.6 MHz from the center in FFT
widths of 7.2 to 8 MHz.
Midwidth
Error
Slope
(dB/MHz)
Rms
e
(nominal)
e. The “RMS” nominal performance is the standard deviation of the response relative to the cen-
ter frequency, integrated across a 10 or 25 MHz span. This performance measure was
observed at a center frequency in each harmonic mixing band, which is representative of all
center frequencies; it is not the worst case frequency.
≤ 3.6 ≤ 10 0.40 dB 0.12 dB 0.10 0.03 dB
3.6 to 26.5 ≤ 10 0.25 dB
≤ 3.6 10, ≤ 25 0.45 dB 0.12 dB 0.05 0.04 dB
3.6 to 26.5 10, ≤ 25 0.80 dB