


40 Chapter 1
Agilent EXA Signal Analyzer
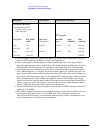
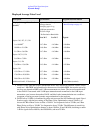
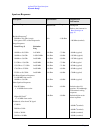
Amplitude Accuracy and Range
a. Supplemental information: The amplitude detection linearity specification applies at all levels
below −10 dBm at the input mixer; however, noise will reduce the accuracy of low level mea-
surements. The amplitude error due to noise is determined by the signal-to-noise ratio, S/N. If
the S/N is large (20 dB or better), the amplitude error due to noise can be estimated from the
equation below, given for the 3-sigma (three standard deviations) level.
The errors due to S/N ratio can be further reduced by averaging results. For large S/N (20 dB
or better), the 3-sigma level can be reduced proportional to the square root of the number of
averages taken.
b. The scale fidelity is warranted with ADC dither set to On. Dither increases the noise level by
nominally only 0.24 dB for the most sensitive case (preamp Off, best DANL frequencies).
With dither Off, scale fidelity for low level signals, around −60 dBm or lower, will nominally
degrade by 0.2 dB.
c. Reference level and off-screen performance: The reference level (RL) behavior differs from
some earlier analyzers in a way that makes this analyzer more flexible. In other analyzers, the
RL controlled how the measurement was performed as well as how it was displayed. Because
the logarithmic amplifier in these analyzers had both range and resolution limitations, this
behavior was necessary for optimum measurement accuracy. The logarithmic amplifier in this
signal analyzer, however, is implemented digitally such that the range and resolution greatly
exceed other instrument limitations. Because of this, the analyzer can make measurements
largely independent of the setting of the RL without compromising accuracy. Because the RL
becomes a display function, not a measurement function, a marker can read out results that are
off-screen, either above or below, without any change in accuracy. The only exception to the
independence of RL and the way in which the measurement is performed is in the input atten-
uator setting: When the input attenuator is set to auto, the rules for the determination of the
input attenuation include dependence on the reference level. Because the input attenuation
setting controls the tradeoff between large signal behaviors (third-order intermodulation and
compression) and small signal effects (noise), the measurement results can change with RL
changes when the input attenuation is set to auto.
d. Mixer level = Input Level − Input Attenuator
e. The relative fidelity is the error in the measured difference between two signal levels. It is so
small in many cases that it cannot be verified without being dominated by measurement
uncertainty of the verification. Because of this verification difficulty, this specification gives
nominal performance, based on numbers that are as conservatively determined as those used
in warranted specifications. We will consider one example of the use of the error equation to
compute the nominal performance.
Example: the accuracy of the relative level of a sideband around −60 dBm, with a carrier at −5
dBm, using attenuator = 10 dB, RBW = 3 kHz, evaluated with swept analysis. The high level
term is evaluated with P1 = −15 dBm and P2 = −70 dBm at the mixer. This gives a maximum
error within ±0.025 dB. The instability term is ±0.018 dB. The slope term evaluates to ±0.050
dB. The prefilter term applies and evaluates to the limit of ±0.005 dB. The sum of all these
terms is ±0.098 dB.
f. Errors at high mixer levels will nominally be well within the range of ±0.045 dB × {exp[(P1 −
Pref)/(8.69 dB)] − exp[(P2 − Pref)/(8.69 dB)]} (exp is the natural exponent function, e
x
). In
this expression, P1 and P2 are the powers of the two signals, in decibel units, whose relative
power is being measured. Pref is −10 dBm (−10 dBm is the highest power for which linearity
is specified). All these levels are referred to the mixer level.
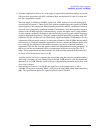
3
σ
320dB()110
SN⁄ 3dB+()20dB⁄()–
+〈〉log=