


44 Chapter 1
Agilent EXA Signal Analyzer
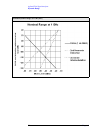
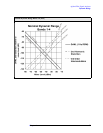
Dynamic Range
Displayed Average Noise Level
Description Specifications Supplemental Information
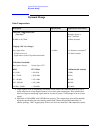
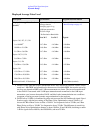
Displayed Average Noise Level
(DANL)
a
a. DANL for zero span and swept is normalized in two ways and for two reasons. DANL is mea-
sured in a 1 kHz RBW and normalized to the narrowest available RBW, because the noise fig-
ure does not depend on RBW and 1 kHz measurements are faster. The second normalization
is that DANL is measured with 10 dB input attenuation and normalized to the 0 dB input
attenuation case, because that makes DANL and third order intermodulation test conditions
congruent, allowing accurate dynamic range estimation for the analyzer.
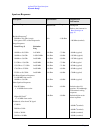
Input terminated Sample or
Average detector
Averaging type = Log
0 dB input attenuation
IF Gain = High
1 Hz Resolution Bandwidth
Refer to the footnote for
Band Overlaps on page 15.
20 to 30°C5 to 50°C Typical
Option 503, 507, 513, 526
1 to 10 MHz
b
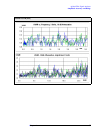
b. DANL below 10 MHz is dominated by phase noise around the LO feedthrough signal. Speci-
fications apply with the best setting of the Phase Noise Optimization control, which is to
choose the “Best Phase Noise at offset < 20 kHz” for frequencies below 25 kHz, and “Best
Phase Noise at offset > 30 kHz” for frequencies above 25 kHz. The difference in sensitivity
with Phase Noise Optimization changes is about 10 dB at 10 and 100 kHz, declining to under
1 dB for signals below 400 Hz, above 800 kHz, and near 25 kHz.
−147 dBm −145 dBm −149 dBm
10 MHz to 2.1 GHz −148 dBm −146 dBm −150 dBm
2.1 GHz to 3.6 GHz −147 dBm −145 dBm −148 dBm
Option 507,513, 526
3.6 GHz to 7 GHz −147 dBm −145 dBm −149 dBm
Option 513, 526
7.0 GHz to 13.6 GHz −143 dBm −141 dBm −147 dBm
Option 526
13.5 GHz to 17.1 GHz −137 dBm −134 dBm −142 dBm
17.0 GHz to 20.0 GHz −137 dBm −134 dBm −142 dBm
20.0 GHz to 26.5 GHz −134 dBm −130 dBm −140 dBm
Additional DANL, IF Gain=Low
c
−160.5 dBm (nominal)