


Chapter 12 157
Noise Figure Measurement Application
General Specifications
Description Specifications Supplemental Information
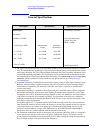
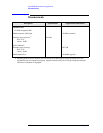
Noise Figure Uncertainty Calculator
a
a. The Noise Figure Uncertainty Calculator requires the parameters shown in order to calculate the total
uncertainty of a Noise Figure measurement.
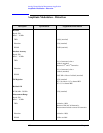
Instrument Noise Figure Uncertainty See the Noise Figure
table earlier in this
chapter
Instrument Gain Uncertainty See the Gain table
earlier in this chapter
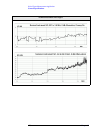
Instrument Noise Figure See graphs of “Nominal Instrument
Noise Figure”; Noise Figure is DANL
+176.24 dB (nominal)
b
Note on DC coupling
c
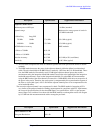
b. Nominally, the noise figure of the spectrum analyzer is given by
NF = D − (K − L + N + B)
where D is the DANL (displayed average noise level) specification,
K is kTB (-173.98 dBm in a 1 Hz bandwidth at 290 K)
L is 2.51 dB (the effect of log averaging used in DANL verifications)
N is 0.24 dB (the ratio of the noise bandwidth of the RBW filter with which DANL is
specified to an ideal noise bandwidth)
B is ten times the base-10 logarithm of the RBW (in hertz) in which the DANL is
specified. B is 0 dB for the 1 Hz RBW.
The actual NF will vary from the nominal due to frequency response errors.
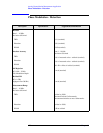
c. The effect of AC coupling is negligible for frequencies above 40 MHz. Below 40 MHz, DC coupling is
recommended for the best measurements. The instrument NF nominally degrades by 0.2 dB at 30 MHz
and 1 dB at 10 MHz with AC coupling.
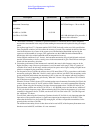
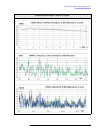
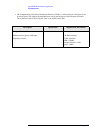
Instrument Input Match See graphs: Nominal VSWR
Note on DC coupling
d
d. The effect of AC coupling is negligible for frequencies above 40 MHz. Below 40 MHz, DC coupling is
recommended for the best measurements.