123
Customizing port performance graphs
You can customize the graph polling frequency, what is plotted in the graphs, and the graph color scheme.
Complete the following steps to customize the port performance graphs:
1. To set the polling frequency for all graphs, click Graph and click Set Polling Frequency.
2. Type an interval, in seconds (0 through 60), and click OK.
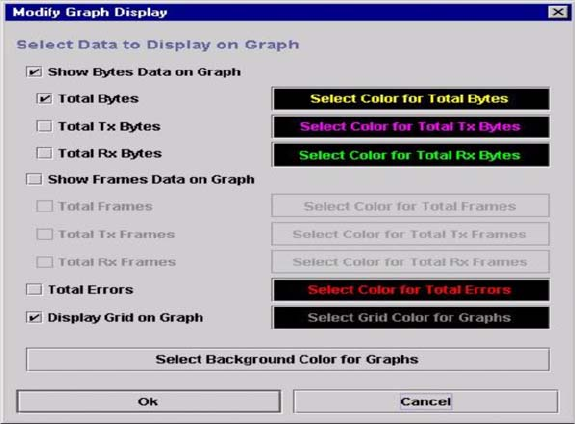
3. To select what is to be plotted, click Graph and click Options. The Modify Graph Display window
opens.
Figure 24. Modify Graph Display window
4. To modify the graph display, select the units for the graph:
• Select the Show Bytes Data on Graph check box to plot data in KB per second.
• Select the Show Frames Data on Graph check box to plot data in frames per second.
5. Choose what data type to plot. For example, if you selected Show Frames Data on Graph in step 4 you
can plot one or all of the following:
• Total frames transmitted and received (Total Frames)
• Total frames transmitted (Total Tx Frames)
• Total frames received (Total Rx Frames)
In addition to these, you can also plot total errors by selecting the Total Errors check box.
6. Display or hide the unit grid. Select the Display Grid on Graph check box to display the unit grid.
7. Choose the color scheme for the graph. You can select the color for each data type, the unit grid, and the
background by clicking the corresponding color field or button. In each case, you can choose a color using
the swatches, Red-Green-Blue (RGB), or Hue-Saturation-Brightness (HSB):
• Swatches – Click the Swatches tab. Select a swatch from the palette and click OK.
• RGB – Click the RGB tab. Select a color by moving the slides to adjust the values for red, blue, and
green; or type values in the fields. Click OK.
• HSB – Click the HSB tab. Select a color using any of the following methods and click OK:
— Click in the color palette.
— Select H, S, or B and use the slide to vary the selected value.
— Type values in the H, S, or B fields.