


122 Intel Blade Server Fibre Channel Switch Module SBCEFCSW / FC Expansion Card SBFCM Guide
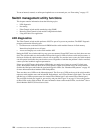
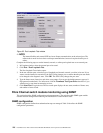
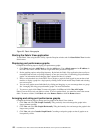
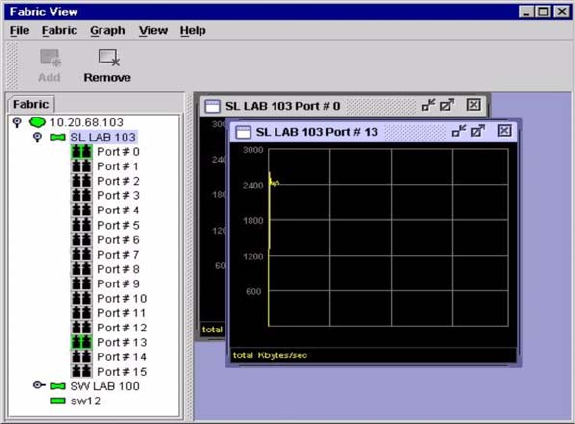
Figure 23. Fabric View graphs
Starting the Fabric View application
To start Fabric View using the SAN Utility, open the Faceplate window and click Start Fabric View from the
Switch menu.
Displaying port performance graphs
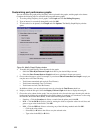
Complete the following steps to display port performance graphs:
1. Click Fabric and select Add Fabric or click the Add button. Type a fabric name and an IP address in
the Add a New Fabric window. Include a login name and a password if required.
2. Set the graphing options and polling frequency. By default, the Fabric View application plots total bytes
transmitted and received at a polling frequency of once per second. See “Customizing port performance
graphs” for information about changing what is plotted and how it is plotted.
3. Select a switch module icon in the Fabric Tree to display a graph for each logged-in port on that switch
module; or display a graph for a single port by clicking on the switch module entry handle and selecting
one or more ports.
4. You can move graphs around individually by clicking and dragging, or you can arrange them as a group.
See “Arranging and sizing port performance graphs” for more information.
5. To remove a graph, click Close. To remove all graphs, click View and click Close All Graphs.
Fabric View can access only one fabric at a time. To access another fabric, you must first remove the current
fabric. To remove a fabric, click Fabric and select Remove Fabric or click the Remove button.
Arranging and sizing port performance graphs
Complete the following steps to arrange and size graphs in the Fabric View window:
1. Click View and select Tile Graphs Vertically. Tiling vertically sizes and arranges the graphs in the
longest columns possible.
2. Click View and select Tile Graphs Horizontally. Tiling horizontally sizes and arranges the graphs in the
longest rows possible.
3. Click View and select Cascade Graph Panels. Cascading overlaps the graphs so that all graphs are at
least partially visible.