


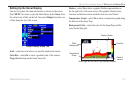
Viewing the Sonar Temperature Tab
NOTE: You must be receiving proper sonar data from another
device, such as a Garmin GSD 20 Sounder Module, to view
temperature information.
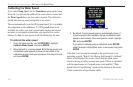
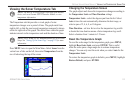
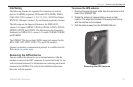
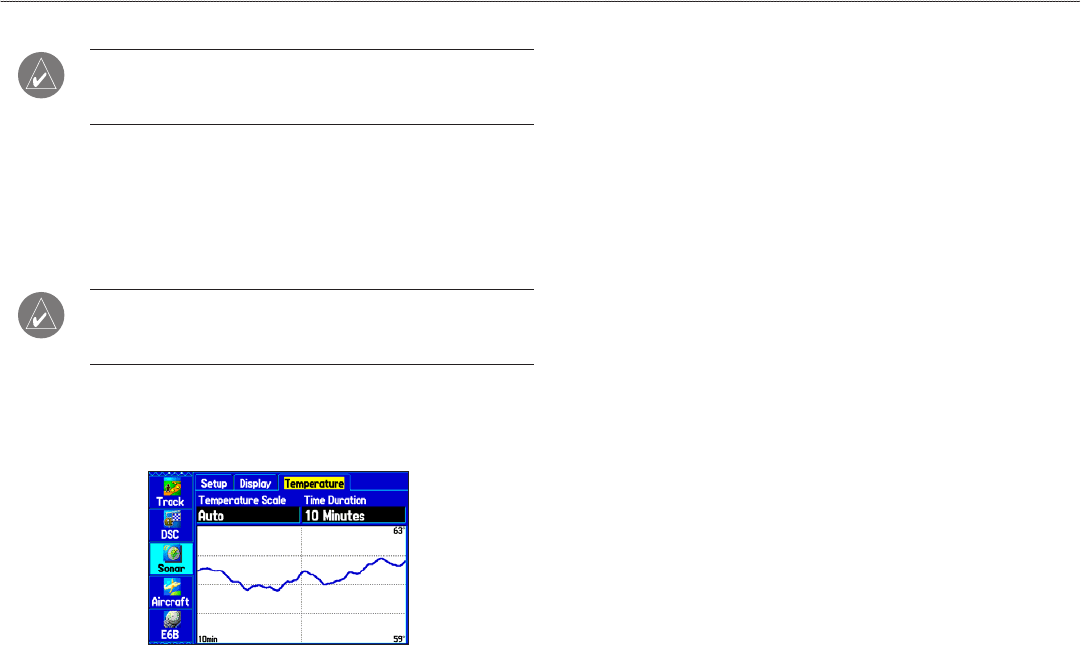
The Temperature sub tab provides a visual graph of water
temperature changes over a period of time. The graph reads from
right to left, so that the most recent temperature measured is shown
on the far right side of the graph. The dotted lines within the graph
indicate intervals in the temperature scale and the duration of time.
NOTE: Select TEMP for the TRANSDUCER type in the Sonar
Setup. See “Setting Up the Sonar Page” on page 125 for more
information.
Press MENU twice to open the Main Menu. Select Sonar from the
vertical row of tabs on the left, then select Temperature from the
row of tabs along the top of the screen.
Changing the Temperature Screen
The graph adjusts and shown the temperatures changes according to
the Temperature Scale and Time Duration settings.
Temperature Scale
—select the degree span from the list. Select
Auto to have the unit automatically determine the best range, or
select a span of 2, 4, 6, 8, or 10 degrees.
Time Duration
—set how fast or slow the temperature log scrolls:
a shorter the time duration means a faster temperature log scroll.
Select a duration from 1 minute to 2.5 hours.
Reset the Temperature Graph
To reset the scale range for the temperature graph, press MENU,
highlight Reset Auto Scale, and press ENTER. This is useful
when the scale spans a large range due to extreme temperature
changes. You can only reset the scale when you select Auto for the
Temperature Scale.
To restore the temperature graph to defaults, press
MENU, highlight
Restore Default, and press ENTER.
Temperature Tab
GPSMAP 296 Pilot’s Guide 131
SETTING UP AND USING SONAR > VIEWING THE TEMPERATURE SONAR TAB