


GS2 Display—StarFire iTC
OUO6050,0002248 –19–14NOV06–4/4
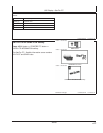
PC9551 –UN–06NOV06
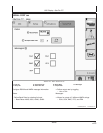
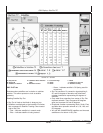
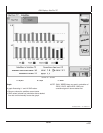
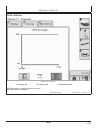
StarFire iTC - Satellites
A—SkyPlot B—Graph C—PDOP
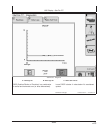
Graph
A graph illustrating L1 and L2 SNR values.
• Bars are colored to satellites current status.
• SNR values (colored bar) should be above dashed
line that runs horizontally across bar graph.
NOTE: ONLY GREEN bars are used in calculation of
PDOP, VDOP, AND HDOP. SNR’s are
considered good if above dashed line.
15-22
121907
PN=30