


GS2 Display—StarFire iTC
OUO6050,0002248 –19–14NOV06–2/4
PC9711 –UN–10NOV06
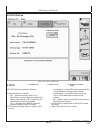
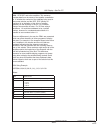
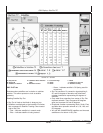
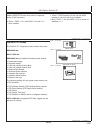
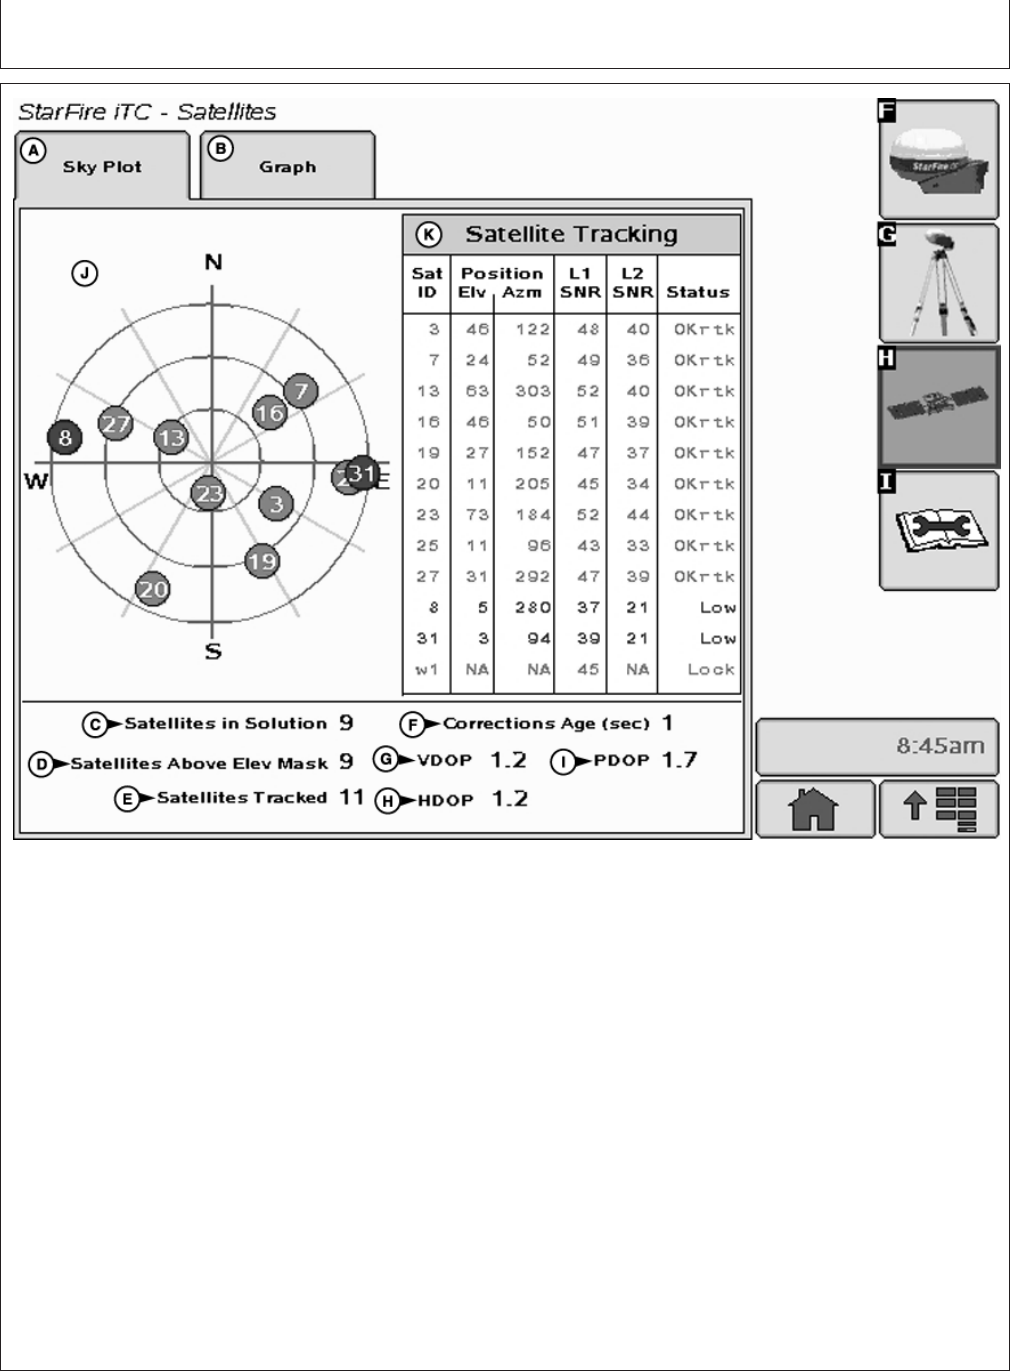
StarFire iTC - Satellites
A—Sky Plot tab D—Satellites Above Elevation F—Corrections Age I—PDOP
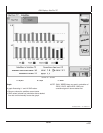
B—Graph tab Mask G—VDOP J—Satellites on Sky Plot
C—Satellites in Solution E—Satellites Tracked H—HDOP K—Satellite Tracking
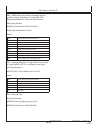
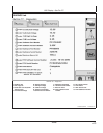
SKY PLOT tab
Illustrates where satellites are in relation to vehicles
receiver. This allows operator to look at satellite
geometry.
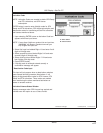
Reading Satellite Sky Plot
• Sky Plot is fixed so that North is always at top.
• Satellites are displayed as their satellite ID number
that correspond to Satellite Tracking Chart located
right of Sky Plot
– Red – indicates satellite is in search mode
– Blue – indicates satellite is being tracked
– Green – indicates satellite is OK (being used for
corrections)
• Sky Plot consists of 3 concentric rings depicting 0,
30, and 60 degrees of elevation with directional
crossbar intersection representing 90 degrees of
elevation.
• Grey radial lines extending from center of Sky Plot
represent azimuth. They are spaced 30 degrees
apart and represent 30 and 60 degrees.
• Directional crossbar representing North, South, East,
and West also represent azimuth at 0, 90, 180, and
270 degrees.
• W1 and W2 (WAAS/EGNOS) satellites and inmarsat
satellites are not shown in Sky Plot.
15-20
121907
PN=28
Continued on next page