


iCOM
Controls Training and Service Manual
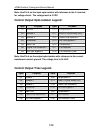
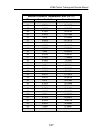
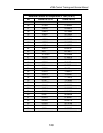
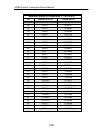
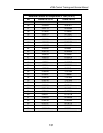
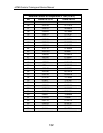
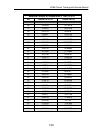
Moisture Content Charts
The following charts show moisture content of various levels of relative humidity
for
given temperatures. Follow the procedures below to use the charts:
STEP 1: Locate the chart for the temperature with which you are working.
STEP 2: Locate the line with the relative humidity with which you are
working.
STEP 3: Read the moisture content of the relative humidity in either grains
per cubic foot or grains per pound of air.
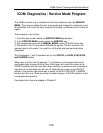
For example, you have a room temperature of 70°F and 50% relative humidity.
STEP 1: Locate the chart for 70°F.
STEP 2: Locate the line with relative humidity 50%.
STEP 3: Read the moisture content value of 50% relative humidity (4.0275
grains per cubic foot of air OR 55.86143 grains per pound of air).
126