A.2 Smart Meter Display
Display description
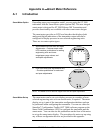
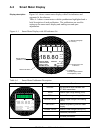
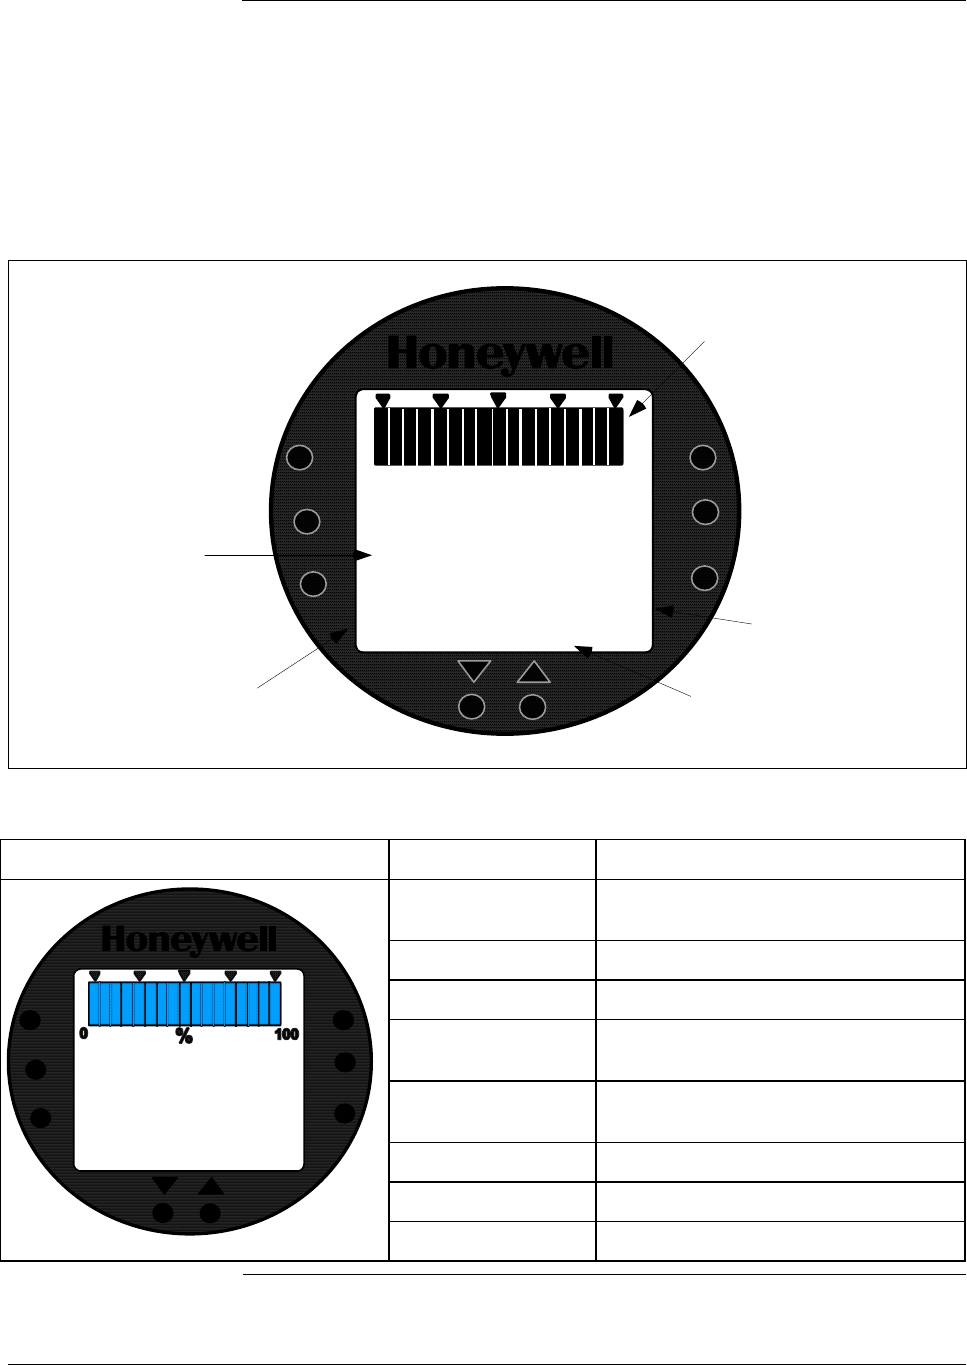
Figure A-1 shows a smart meter display with all its indicators and
segments lit for reference.
Table A-1 shows a smart meter with the pushbuttons highlighted and a
brief description of each pushbutton. The pushbuttons are used for
setting up the smart meter display and making zero and span
adjustments.
Figure A-1 Smart Meter Display with All Indicators Lit.
UPPER
VALUE
UNITS
LOWER
VALUE
SET
%
100
0
1
8
.
808
-
ANALOG
In H O
2
K
GPH
mmHg
GPM PSI
A
OUTPUT MODE
CHECK STATUS
FAULT - LAST
KNOWN VALUE
%
FLOW
o
F
o
C
VAR
SEL.
SPAN
ZERO
Digital Readout
(-19990 to +19990)
Status Indicators
17-Segment Bargraph
(0 to 100%)
Engineering Unit
Indicators
K Multiplier -
Indicates digital readout
is multiplied by 1,000
Table A-1 Smart Meter Pushbutton Description
Smart Meter Pushbuttons Pushbutton Function
VAR SEL. Not functional when installed with
ST 3000 transmitters.
SPAN Selects Span range setting (URV).
ZERO Selects Zero range setting (LRV).
UPPER VALUE Selects Upper Range Value setting
(URV).
UNITS SET Selects engineering units for meter
display.
LOWER VALUE Selects Lower Range Value (LRV).
Decrease pushbutton
UPPER
VALUE
UNITS
LOWER
VALUE
SET
1
8
.
808
-
ANALOG
In H O
2
K
GPH
mmHg
GPM PSI
A
OUTPUT MODE
CHECK STATUS
FAULT - LAST
KNOWN VALUE
%
FLOW
o
F
o
C
VAR
SEL.
SPAN
ZERO
Increase pushbutton
52 ST 3000 Release 300 Installation Guide 2/05


