


GPSMAP 400/500 Series Owner’s Manual 57
Using Sonar
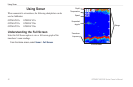
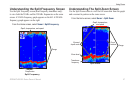
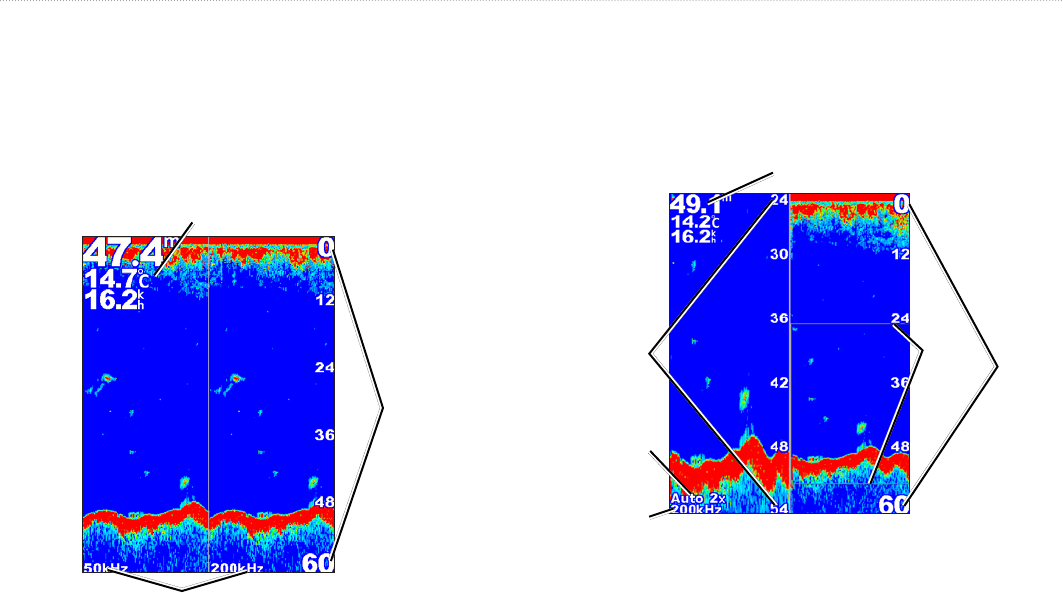
Understanding the Split Frequency Screen
Use the Split Frequency screen (dual-frequency transducer only)
to view both the 50 kHz and the 200 kHz frequencies on the same
screen. A 50 kHz frequency graph appears on the left. A 200 kHz
frequency graph appears on the right.
From the Home screen, select Sonar > Split Frequency.
Depth, temperature, and speed
Range
Frequencies
Split Frequency
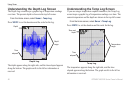
Understanding The Split Zoom Screen
Use the Split Zoom screen to view the full sonar data from the graph
and a zoomed in portion on the same screen.
From the Home screen, select Sonar > Split Zoom.
Transducer
frequency
Depth, temperature,
and speed
Range
Zoom
window
Zoomed
depth scale
Zoom level
Split Zoom