


CAUTIONCAUTION
10
Tact Audio
DYNAMIC ROOM CORRECTION
Dynamic Room Correction (DRC) ® is new technology developed by Tact Audio
Inc. over past two years. This groundbreaking brings the science and art of Room
Correction, and specifi cally Tact room correction products, to yet another level.
When we introduced our fi rst RCS system (the Tact-2.2 in the late 90’s) we were
fully aware that we were embarking on a long term research process in the new
exciting fi eld of room acoustics correction. As a result of this research effort we
brought to the market products such as Tact-2.0 S two channel RCS preamp, the
Tact-2.2 X two channel preamp with RCS on two main and two subwoofer chan-
nels, and the TCS MKII ten channel theater correction system. All these systems
offer RCS technology not found in any other product on the market. Our contin-
ued research combined with enormously valuable feedback from our customers
has resulted in this new technology that we named Dynamic Room Correction
(DRC)®.
Why do we call it Dynamic Room Correction (DRC)?
The reason we call it DRC is that the target curve used to compute correction fi l-
ters dynamically changes with the master level control. In another words, for every
0.1 dB of level change the system uses a new target curve to compute room cor-
rection fi lters. What makes this dynamic is that all computations and adjustments
are done on the fl y without any interruption to the music you listen to.
Why do we need Dynamic Room Correction (DRC)?
It is well known fact that humans do not here all frequencies at the same level.
It is also known that our ears are more sensitive to frequencies between 2000
and 5000 Hz than to frequencies bellow 2000 Hz and above 5000 Hz. In addi-
tion to this our hearing sensitivity changes with sound pressure level (SPL). This
human hearing property was fi rst discovered and experimentally confi rmed by
Fletcher and Munson at Bell Laboratories in 1933 and later refi ned by Robinson
and Dadson in 1956. Their work resulted in a family of equal loudness curves
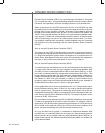
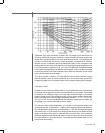
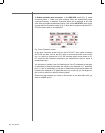
(contours), widely known as Fletcher-Munson equal loudness curves. A sample of
Fletcher-Munson loudness curves is shown in the fi gure bellow.
On the graph there are 12 curves numbered from 0 to 110. These numbers repre-
sent the loudness level in phons. A Phon is a unit used to describe the loudness
level of a given sound. The reason for introducing the loudness unit is that two
sounds with the same SPL (dB) do not necessarily have the same perceived loud-
ness. Phon is equal to SPL in decibels at 1000 Hz. For example, 80 phons means
as loud as 80 dB, 1000 Hz tone.
Equal loudness curves represent the SPL that different frequencies need to have
in order to be perceived as two tones of equal loudness. For example, a 200 Hz
tone at SPL of 50 dB will have the same perceived loudness as a 1000 Hz tone at
SPL of 40 dB. In this case both 200 Hz and 1000 Hz tones have a loudness of 40
phons, and they both belong to the 40 phons equal loudness curve.
As it can be seen from the graph, in comparison to frequencies between 2000
and 5000 Hz, it is intrinsically harder for us to hear very low frequencies (below a
few hundred Hz) and to a lesser extent very high frequencies (above 7000 Hz). At
higher listening levels this difference gradually becomes smaller and smaller and
curves become fl atter.