


7
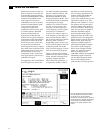
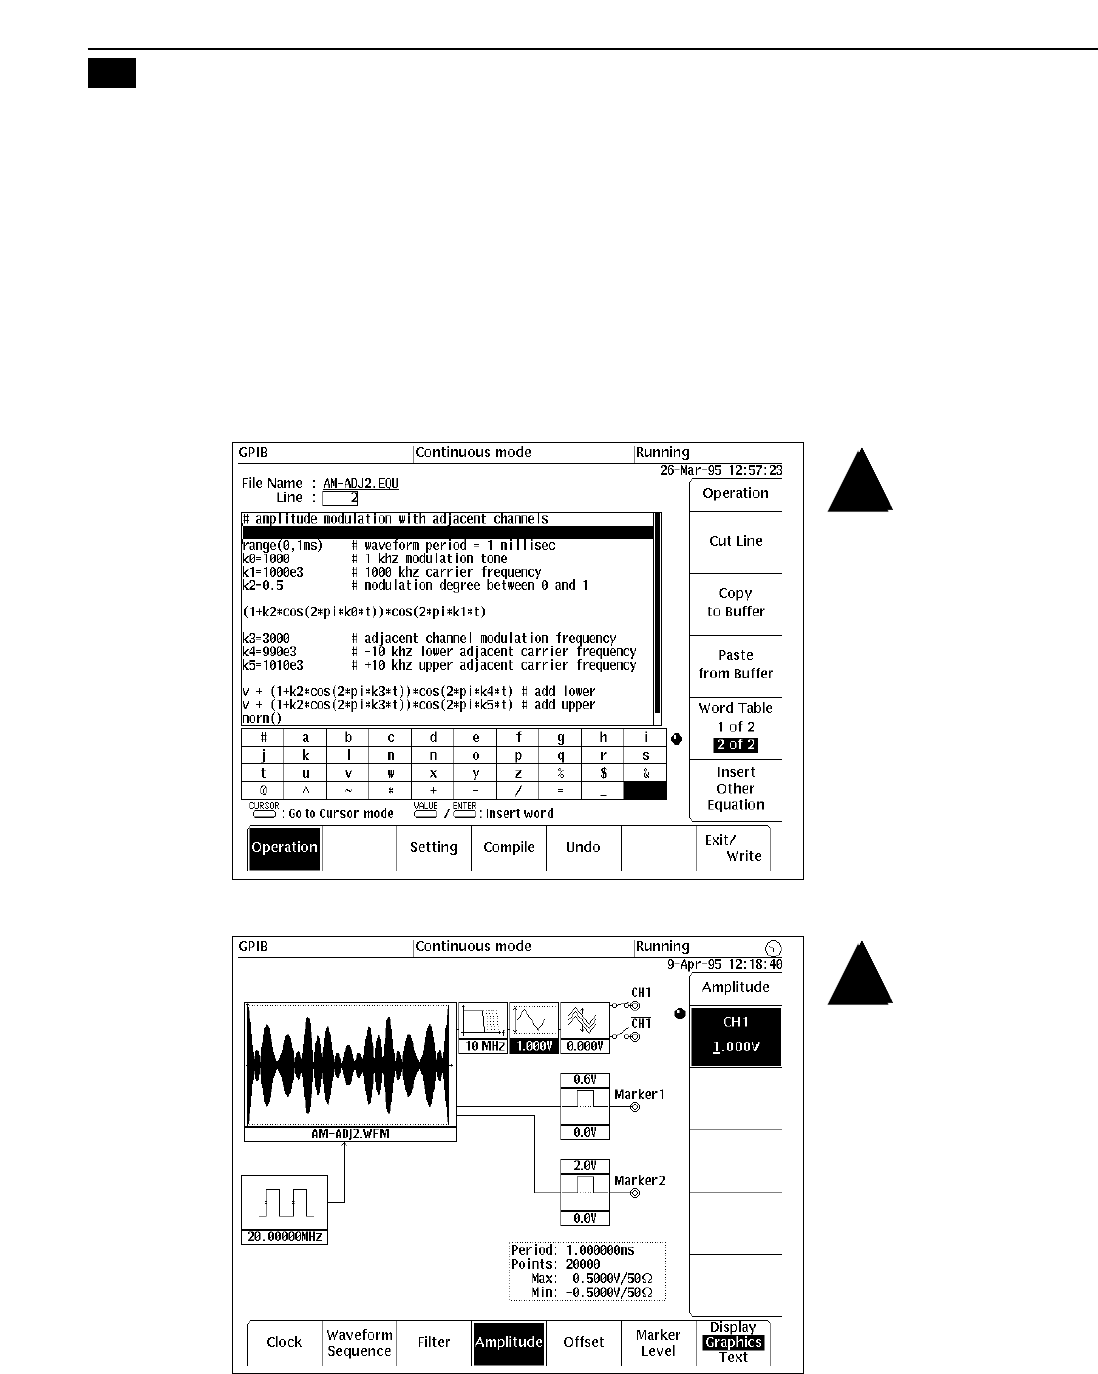
A simple addition to the AM
signal demonstrates the flexibility
of equation-based waveform
descriptions. A common task in
evaluating receiver performance
is to evaluate the effect of adja-
cent carriers. For the basic AM
signal, one can easily add modu-
lated carriers 10 kHz above and
below the original signal
(Figure 4). One simply adds two
copies of the basic AM equation
to the original equation. The
modulation frequency of the
adjacent carriers was changed to
3 kHz for later identification,
and the carrier frequencies were
altered accordingly. In this case,
the amplitudes are not explicitly
selected, and the AWG’s
normalization function (last
line) is used to automatically
scale the peak values encoun-
tered in the equation to ensure
that there is no clipping within
the AWG when the signals are
added together. The output level
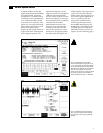
can be set as needed using the
AWG’s setup menu (Figure 5). In
this case the signal amplitude is
set to 1 V peak-to-peak. The
setup menu summarizes key
waveform parameters such as
the 20 MHz sampling rate and
20,000 point record length. The
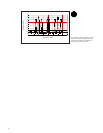
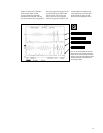
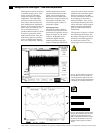
resulting spectrum of the three
modulated carriers is shown in
Figure 6 (on the following page).
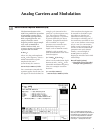
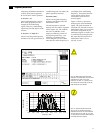
Figure 5. The AWG’s setup menu allows direct
entry of the peak-to-peak waveform amplitude.
The record of the 3-carrier signal is graphically
displayed.
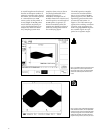
AM with Adjacent Carriers
2
Figure 4. Two additional carriers are added
10 kHz above and below the original carrier. The
“v” term in the equation is a place holder with the
current value of the equation. This allows adding
additional terms on separate lines in the equation
editor. The cosine operator was used in this
example. We can still use the 1 millisecond period
since exactly 3 periods of the 3 kHz adjacent
channel modulation tones occur in 1 millisecond.