


10
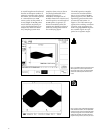
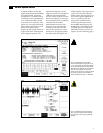
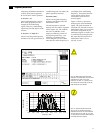
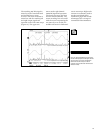
The 11 tone equation was then
modified so that the last 5 tones
(71 through 75 MHz) are
inverted. The two different
multi-tone results are shown in
Figure 9. The scope shows that
the rms levels of the two signals
are identical, but the peak-to-
peak values are different. All
eleven tones in the original
signal added in-phase at t=0.
This was not the case with the
second signal where 5 of the
carriers were inverted at t=0.
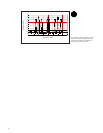
Thus, the crest factor (peak-to-
rms ratio) of the two signals
changed from 4.6 (original) to
3.4 (modified). This difference
can have dramatic results when
using multi-tones to test for satu-
ration in transmitter or receiver
stages. While both signals have
the same power level, the peak
levels are quite different.
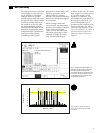
Absolute control of phase rela-
tionships means that the AWG
can ensure repeatable worst case
testing, which is not possible
with a non-coherent collection
of signal generators. The AWG’s
marker output can simplify in-
circuit performance characteri-
zation since a scope can be
triggered at the exact instant of
the test signal’s peak value.
Figure 9. Scope plot of the original multi-tone
(top trace) and multi-tone signal with five tones
inverted (center trace). The rms levels are the
same, but the peak-to-peak amplitudes differ.
The bottom trace is the AWG marker output
identifying the beginning of the record.
Multi-tone signal
Inverted tones
Marker