Appendix B: Automatic Measurements Supported
CSA7000 Series, TDS7000 Series, & TDS6000 Series Instruments User Manual
B-9
Measurements Annotations
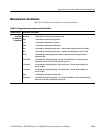
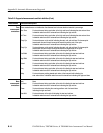
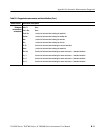
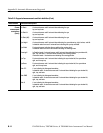
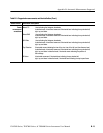
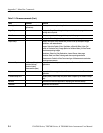
Table B--2 describes the annotations for each measurement.
Table B- 2: Supported measurements and their definition
Measurements Annotation descriptions
Amplitude
measurement
annotations
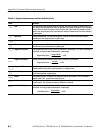
Amplitude 2 horizontal bars indicating the amplitude value.
High 1 horizontal bar indicating the high value.
Low 1 horizontal bar indicating the low value.
RMS 1 horizontal bar indicati ng the RMS value.
Max 1 horizontal bar indi cating the Max value. 1 vertical arrow indicating the time of the Max.
Min 1 horizontal bar indicating the Min value. 1 vertical arrow indicating the time of the Min.
Pk-Pk 2 horizontal bars indicating the Max and Min. 2 vertical arrows indicating the time of
the Max and Min.
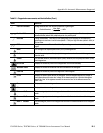
Cycle RMS 3 horizontal bars indicating the High, the Low, and the RMS value. 2 horizontal arrows
facing each other at the mid ref indicating the cycle time.
+Overshoot 3 horizontal bars indicating the Max, High, and the Low. 1 vert ical arrow indicating the
time of the Max.
--Overshoot 3 horizontal bars indicating the High, Low, land the Min. 1 vertical arrow indicating the
time of the Min.
Mean 1 horizontal bar i ndicating the Mean value.
Cycle Mean 3 horizontal bars indicating the High, Low, and the Cycle Mean. 2 horizontal arrows facing
each other at the mid ref indicating the cycle time.


