


Chapter 1
General Information
Introduction
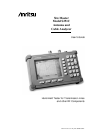
This chapter provides a description, performance specifications, optional accessories, pre
-
ventive maintenance, and calibration requirements for the Site Master model S251C.
Throughout this manual, the term Site Master will refer to the S251C.
Model
Frequency Range Ports
S251C 625 to 2500 MHz 2
Description
The Site Master is a hand held SWR/RL (standing wave ratio/return loss), transmission
gain/loss and Distance-To-Fault (DTF) measurement instrument that includes a built-in
synthesized signal source. The S251C includes a keypad to enter data and a VGA (640 ´
480) liquid crystal display (LCD) to provide graphic indications of SWR, RL (dB) over the
selected frequency range and distance. The Site Master is capable of up to 2.5 hours of con-
tinuous operation from a fully charged field-replaceable battery and can be operated from a
12.5 VDC source. Built-in energy conservation features can be used to extend battery life
over an eight-hour work day.
The Site Master is designed for measuring SWR, return loss, or one-port cable insertion
loss and fault locations of RF components in antenna systems. Power monitoring is avail-
able as an option. Site Master model S251C includes transmission gain or loss (S21) mea-
surements and an optional built-in bias tee. The displayed trace can be scaled or enhanced
with frequency markers or a limit lines. A menu option provides for an audible “beep”
when the limit value is exceeded. To permit use in low-light environments, the LCD can be
back lit using a front panel key.
Standard Accessories
The Software Tools PC-based software program provides a database record for storing
measurement data. Site Master Software Tools can also convert the Site Master display to a
Microsoft Windowsä 95/98/2000/ME/NT workstation graphic. Measurements stored in the
Site Master internal memory can be downloaded to the PC, and vice versa, using the in
-
cluded null-modem serial cable. Once stored, the graphic trace can be displayed, scaled, or
enhanced with markers and limit lines. Historical graphs can be overlaid with current data,
and underlying data can be extracted and used in spreadsheets or for other analytical tasks.
The Site Master Software Tools program can display all of the measurements made with the
Site Master (SWR, return loss, cable loss, distance-to-fault) as well as providing other func
-
tions, such as converting display modes and Smith charts. Refer to Chapter 5, Software
Tools, for more information.
1-1
1