


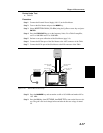
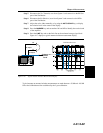

Plot Capture
To open the plot capture menus, select the capture icon on the button bar, or select the Cap
-
ture
drop down menu from the menu bar.
Select
Capture to Screen to download traces to the PC.
Highlight a folder, or highlight individual traces within a folder, to be downloaded to the
PC. The traces will appear on the PC display as they are downloaded.
Plot Properties
After downloading, certain plot properties and information can be modified. Select the Plot
Properties or Plot Information icon, or right click on the graph area of the trace.
Plot Properties that can be changed include:
Graph Titles
Display Mode
Scale/Limit
Markers
Misc.
Graph Titles
After downloading the plot, the Main Title can be changed to reflect the site name or other
descriptive information. The Sub Title field can be used to describe the specifics of the
measurement and configuration.
Display Mode
Display Mode allows changing the display type without having to retest. Plots can be
changed from
Return Loss to VSWR with single click of mouse button.
Scale/Limit
The scale of the displayed plot can be modified to help analyze whether the plot meets
pass/fail criteria. The Scale/Limit sub menu activates options to manually enter the scale
limits, or to use the Auto Scale mode.
Manual adjustment sets the upper and lower limits of the display under the
Scale/Limit Submenu.
Auto Scale automatically adjusts the scale for maximum and minimum mea
-
surement readings.
Limit Line Off turns off all limit lines.
Single Limit Line can be activated to help identify faults. Typical antenna speci
-
fications require better than –15 dB return loss.
Multi-Segment Limit Lines can be activated to set different limits within the
same measurement display for specification requirements.
5-4
Chapter 5 Software Tools Program