Generally speaking, if the only thing between the transducer and
the bottom is water, the first strong return comes from the bottom
directly below the transducer and sets the bottom level. Weaker
secondary returns provide the detailed data. Stronger returns display
in darker colors, with red being the strongest return.
Understanding the Sonar Display
One of the first things to understand about sonar is that the
transducer sends a beam down to the bottom of the water, much like
the beam of a flashlight. The beam starts small near your vessel and
expands as it gets to the bottom. See “Transducer Coverage” for
more detailed information.
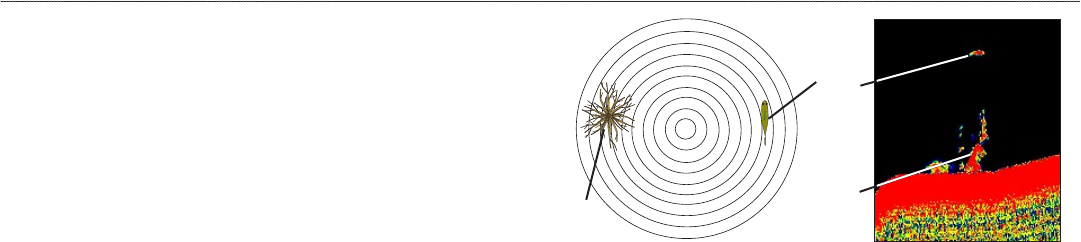
The Sonar Page does not display a three-dimensional representation
of the underwater environment; the display is in two-dimensions,
much like if you took a picture of an aquarium. Only the depth of
the item in the water appears. The Sonar display does not show you
where an item is located horizontally in the water, as shown in the
drawings below. The fish is not directly above the tree in reality, but
it might look like it is on the Sonar Page.
Aerial View of the Water Sonar Display
Fish
Tree
Tree
Transducer Coverage
The area covered by the transmitted sound waves is determined
by the cone angle of the transducer and the water depth. The wide
cone angles (40°) associated with low frequencies (50 kHz) provide
a large coverage area for finding fish within a coverage width that
is approximately 2/3 of the water depth. However, this also means
that wide cone angles produce less bottom detail and resolution. As
shown in the drawing on the near right, the 40° cone angle produces
a coverage area of approximately a 20-foot diameter circle at a 30-
foot depth.
98 GPSMAP 276C Owner’s Manual
SETTING UP AND USING SONAR > UNDERSTANDING SONAR