


96
Making Measurements
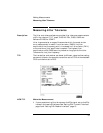
Measuring Jitter Transfer
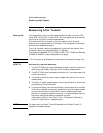
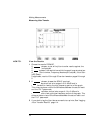
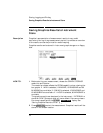
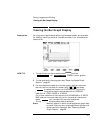
HOW TO: View the Results
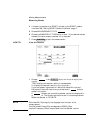
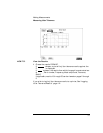
1 Choose the results FORMAT.
If is chosen, a plot of the jitter transfer results against the
ITU-T mask is displayed.
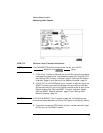
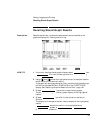
If is chosen, the results from which the graph is constructed are
displayed: Point number, Frequency, Mask amplitude (dB), Jitter Gain
(dB), Result.
If applicable, results 13 through 55 can be viewed on pages 2 through
5.
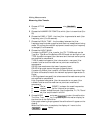
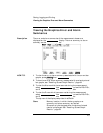
2 If is chosen, choose the SCALE required.
provides a vertical axis range of +5 to -60 dB and is
recommended for viewing the high frequency portion of the graph.
This allows a clearer view of the difference between the actual result
and the ITU-T pass mask.
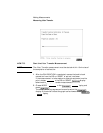
provides a vertical axis range of +3 to -3 dB and is
recommended for viewing the low frequency portion of the graph. This
allows a clearer view of the difference between the actual result and
the ITU-T pass mask.
3 If you wish to log the jitter tolerance results to a printer, See “Logging
Jitter Transfer Results” page 114.
GRAPH
TEXT
GRAPH
WIDE
NARROW