


91
Making Measurements
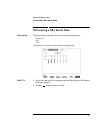
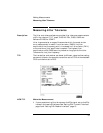
Measuring Jitter Tolerance
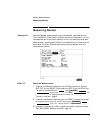
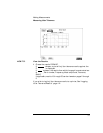
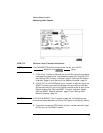
HOW TO: View the Results
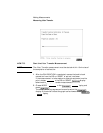
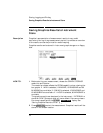
1 Choose the results FORMAT.
If is chosen, a plot of the jitter tolerance results against the
ITU-T mask is displayed.
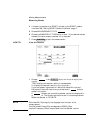
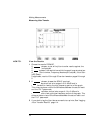
If is chosen, the results from which the graph is constructed are
displayed, Point number, Frequency, Mask amplitude, Tolerance,
Result.
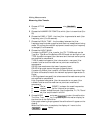
If applicable, results 13 through 55 can be viewed on pages 2 through
5.
If you wish to log the jitter tolerance results to a printer, See “Logging
Jitter Tolerance Results” page 112.
GRAPH
TEXT