


10 TASCAM TA-1VP
About the technology
The models employed by the TA-1VP are not derived
from theoretical considerations. They are generated by
a proprietary analysis process that is applied to each
physical mic modeled. Not only the sonic characteristics,
but the behavior of other parameters such as low-cut
filters or proximity effects accurately reflect the specific
performance of each microphone modeled.
Another advantage of this model-based approach is that
there is essentially no processing delay apart from the
natural phase effects of the microphones being modeled.
Finally, the quality and signal-to-noise characteristics
of the processing are pristine. Because of Antare's
commitment to model-based processing, there are none
of the limitations or distortions characteristic of FFT-based
algorithms. The quality of the output is limited only by the
quality of the input.
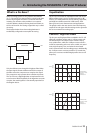
So what exactly does it do?
While there is a lot of fairly complicated stuff going on
under the hood, the essential functionality of the TA-1VP's
Mic Modeling module is really quite simple. Basically,
audio originally recorded by a microphone is input to
the TA-1VP where it is first processed by a “Source Model”
which serves to neutralize the known characteristics of
the input mic. The audio is then processed by a second
“Modeled Mic” model which imposes the characteristics
of the modeled mic onto the previously neutralized signal.
Finally, the audio is passed through a model of a high-
quality tube preamp offering the option of classic tube
saturation distortion.
Understanding Compression
Compression is probably the most widely used (and
potentially confusing) signal process used in today’s
studios. Simply put, compression reduces the dynamic
range of a signal. That is, it reduces the difference in
loudness between the loudest and quietest parts of a
piece of music. Another way to think about this is that the
compressor is acting as an automatic fader which fades
down when the signal gets loud and fades back up when
the signal gets soft.
Why reduce the dynamic range? Consider the problem
of mixing the vocal in a contemporary rock or pop song.
Typically, pop music has a relatively consistent level of
loudness. If an uncompressed vocal track is added to a
typical pop mix, loudly sung words or syllables would
jump out of the mix, while quieter phrases would be
buried beneath the instrumental texture. This is because
the difference between the loudest and softest sounds
in the vocal - its dynamic range - is very large. This same
problem occurs for any instrument which has a dynamic
range larger than the music bed into which it is being
mixed. (For that reason, most instruments, not just vocals,
undergo some compression in the typical mix.)
By using a compressor to decrease the dynamic range of
the vocal, the softer sounds are increased in loudness and
the loudest sounds are reduced in loudness, tending to
even out the overall level of the track. The overall level of
the compressed track can then be increased (using what
is referred to as “make-up gain”), making the vocal track
louder and more consistent in level, and therefore easier
to hear in the mix.
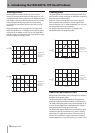
Threshold and Ratio
How is compression measured? What is a little
compression and what is a lot of compression?
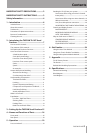
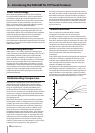
The effect a compressor has on a track is determined by
the settings of its threshold and ratio. The threshold is the
level above which the signal is attenuated. The ratio is the
measure of how much the dynamic range is compressed.
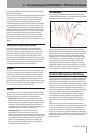
The graph shown below shows the relationship between
the input level of a signal and the output level of the
signal after compression. Notice that signals that are
louder than the threshold are compressed (reduced
in level) while those softer than the threshold are
unchanged.
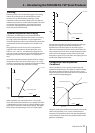
As the input signal exceeds the threshold, gain reduction
(reduction in loudness) is applied. The amount of gain
reduction that is applied depends on the compression
ratio. The higher the compression ratio, the more gain
reduction is applied to the signal.
The graph shows the relationship between compression
ratio and gain reduction. Examine the 2 to 1 ratio curve.
For signals above the threshold, this setting transforms a
range of loudness 2 units large into a range of loudness
one unit large (i.e., if the input signal gets “x” units louder,
the compressed signal increases by only “x/2” units).
OUTPUT
LEVEL
INPUT LEVEL
LOUDER
LOUDER
THRESHOLD
I/O CURVE
1 TO 1 RATIO
2 TO 1 RATIO
4 TO 1 RATIO
8 TO 1 RATIO
99 TO 1 RATIO
2 – Introducing the TASCAM TA-1VP Vocal Producer