


TPA005D12 Class-D EVM Performance Characteristics
3-22
Details
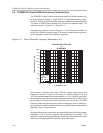
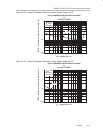
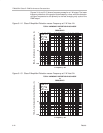
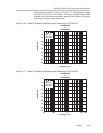
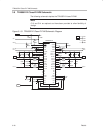
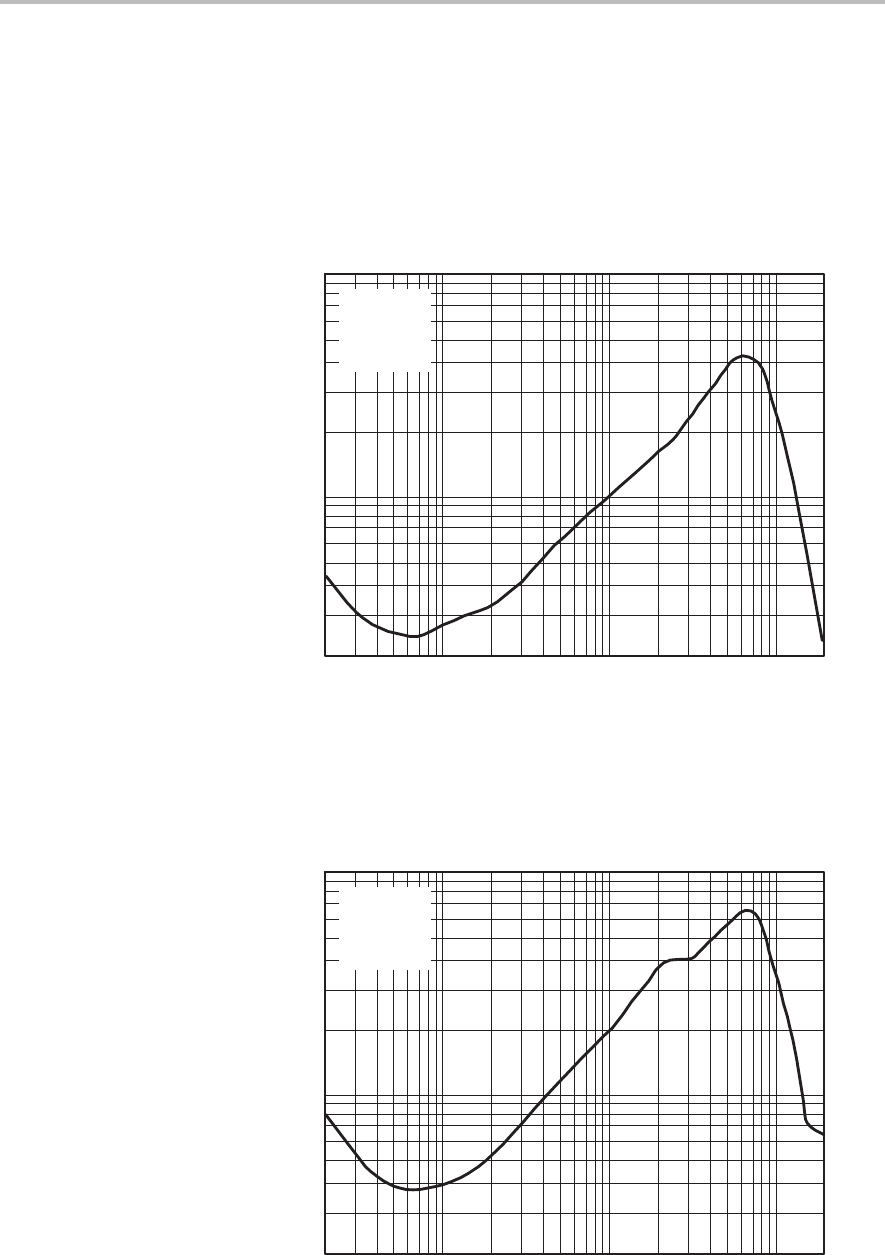
Figures 3–14 and 3–15 show a frequency sweep for a 1-W output. The lower
frequency distortion of the graphs is dominated by noise, while the distortion
at higher frequencies is due primarily to the fast-changing duty cycle of the
PWM output.
Figure 3–14. Class-D Amplifier Distortion versus Frequency at 1 W Into 4
Ω
1
0.02
20 100 1k
THD+N – Total Harmonic Distortion Plus Noise – (%)
f – Frequency – Hz
TOTAL HARMONIC DISTORTION PLUS NOISE
vs
FREQUENCY
10k 20k
0.1
V
DD
= 5 V
R
L
= 4 Ω
P
O
= 1 W
TA = 25° C
Figure 3–15. Class-D Amplifier Distortion versus Frequency at 1 W Into 8
Ω
1
0.02
20 100 1k
THD+N – Total Harmonic Distortion Plus Noise – (%)
f – Frequency – Hz
TOTAL HARMONIC DISTORTION PLUS NOISE
vs
FREQUENCY
10k 20k
0.1
V
DD
= 5 V
R
L
= 8 Ω
P
O
= 1 W
TA = 25° C