


17
ULTRACURVE PRO DEQ2496
4. APPLICATIONS
4. APPLICATIONS
The universal concept of the BEHRINGER ULTRACURVE PRO
with its multitude of audio processing functions opens up a whole
range of applications. A few examples with typical settings will
be described in the following.
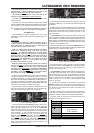
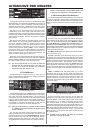
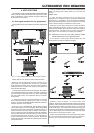
4.1 Sum-signal equalizer for live applications
This application is the most probable use of the ULTRACURVE
PRO.
Fig. 4.1: The ULTRACURVE PRO as sum-signal equalizer
Please observe a few points to achieve optimum results:
Before you start equalizing the frequency response of your
audio system, we recommend that you listen to uncorrected
music and speech material, which has proven useful in practice:
If distortion occurs, it is liable to be caused by the system and
should be eliminated there.
The setup of the speaker stacks is also important. No equalizer
can substantially improve a sound that is muddied by reflections
from the ceiling and the walls of the room. Often, experiments
with the speaker setup and orientation allow for dramatic
improvements.
In a multi-way system you should also eliminate run-time and
phase differences before equalizing the system (our digital
frequency crossover ULTRADRIVE PRO DCX2496 provides all
functions required for this purpose).
Now its the turn of the DEQ2496. The automatic analyzing
routine (AEQ) helps you find an acceptable basic setting. Make
sure that the measurement microphone is positioned correctly. It
should be located in the direct field of radiation of the system,
and any negative acoustic circumstances should be eliminated.
It is of no use to place the microphone behind a curtain, less than
one meter away from side or rear walls, or on an open balcony,
as this would deteriorate the measuring results. Background
noise must be at least 12 dB below the measuring level to ensure
valid measurements.
Once the system has been analyzed automatically with the
AEQ, the resulting basic setting allows you to fine-tune the
system.
Please note:
A linear frequency response curve is not ideal for all
applications. For example, for speech transmission intelligibility
is the key. As a consequence, the curve should be increasingly
flat towards the low-frequency range, because here the human
voice produces nothing but interference (rumble noise).
Extremely low and high frequencies are usually reproduced
with considerably less energy. There is no point in forcing a
small full-range speaker box to reproduce a frequency response
well below 50 Hz. The best result you can get is the need for
more powerand more money for repairing the speakers.
+ Whenever you set up your audio system, please
always take account of its physical limits.
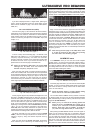
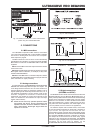
If time permits, make several measurements with the
measurement microphone at different positions.
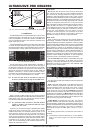
Fig. 4.2: Positioning the measurement microphone
Positions 1 and 3 are approx. 1 m on-axis in front of the
speakers, about half the distance between midrange and tweeter
systems. These measurements are used to verify the functioning
of all loudspeakers. Position 2 is located about 2 m in front of the
center of the stage. The measurement should yield roughly the
same result above 250 Hz as the measurements made at positions
1 and 3. Below 250 Hz, the summing of the low-frequency range
should result in a level boost of approx. 3 dB.
Position 4 is located directly in front of the FOH mixing console.
The curve measured here should be the same as at position 2,
however, with a lower level due to the greater distance.